


The Decades Long Rate Dance
10-year Treasury yield has returned to a very familiar place, for a very familiar dance

The Treasury market responded very well to a slightly better-than-expected inflation report earlier this week. Following the release of the April CPI, the yield on the 10-year Treasury fell to 4.3%, a level I have highlighted many times in my Mortgage Locksmith Report as an opportunity to lock in mortgage rates for clients.
Why 4.3%? Simple, it’s been here before… many times. In technical analysis, we say that the more times a security touches a particular price point, the more important that price point becomes. In this case, it’s not price but yield, and we are talking about the yield on a 10-year Treasury note. Thanks for reading Macro To Mortgage! Subscribe for free to receive new posts and support my work.
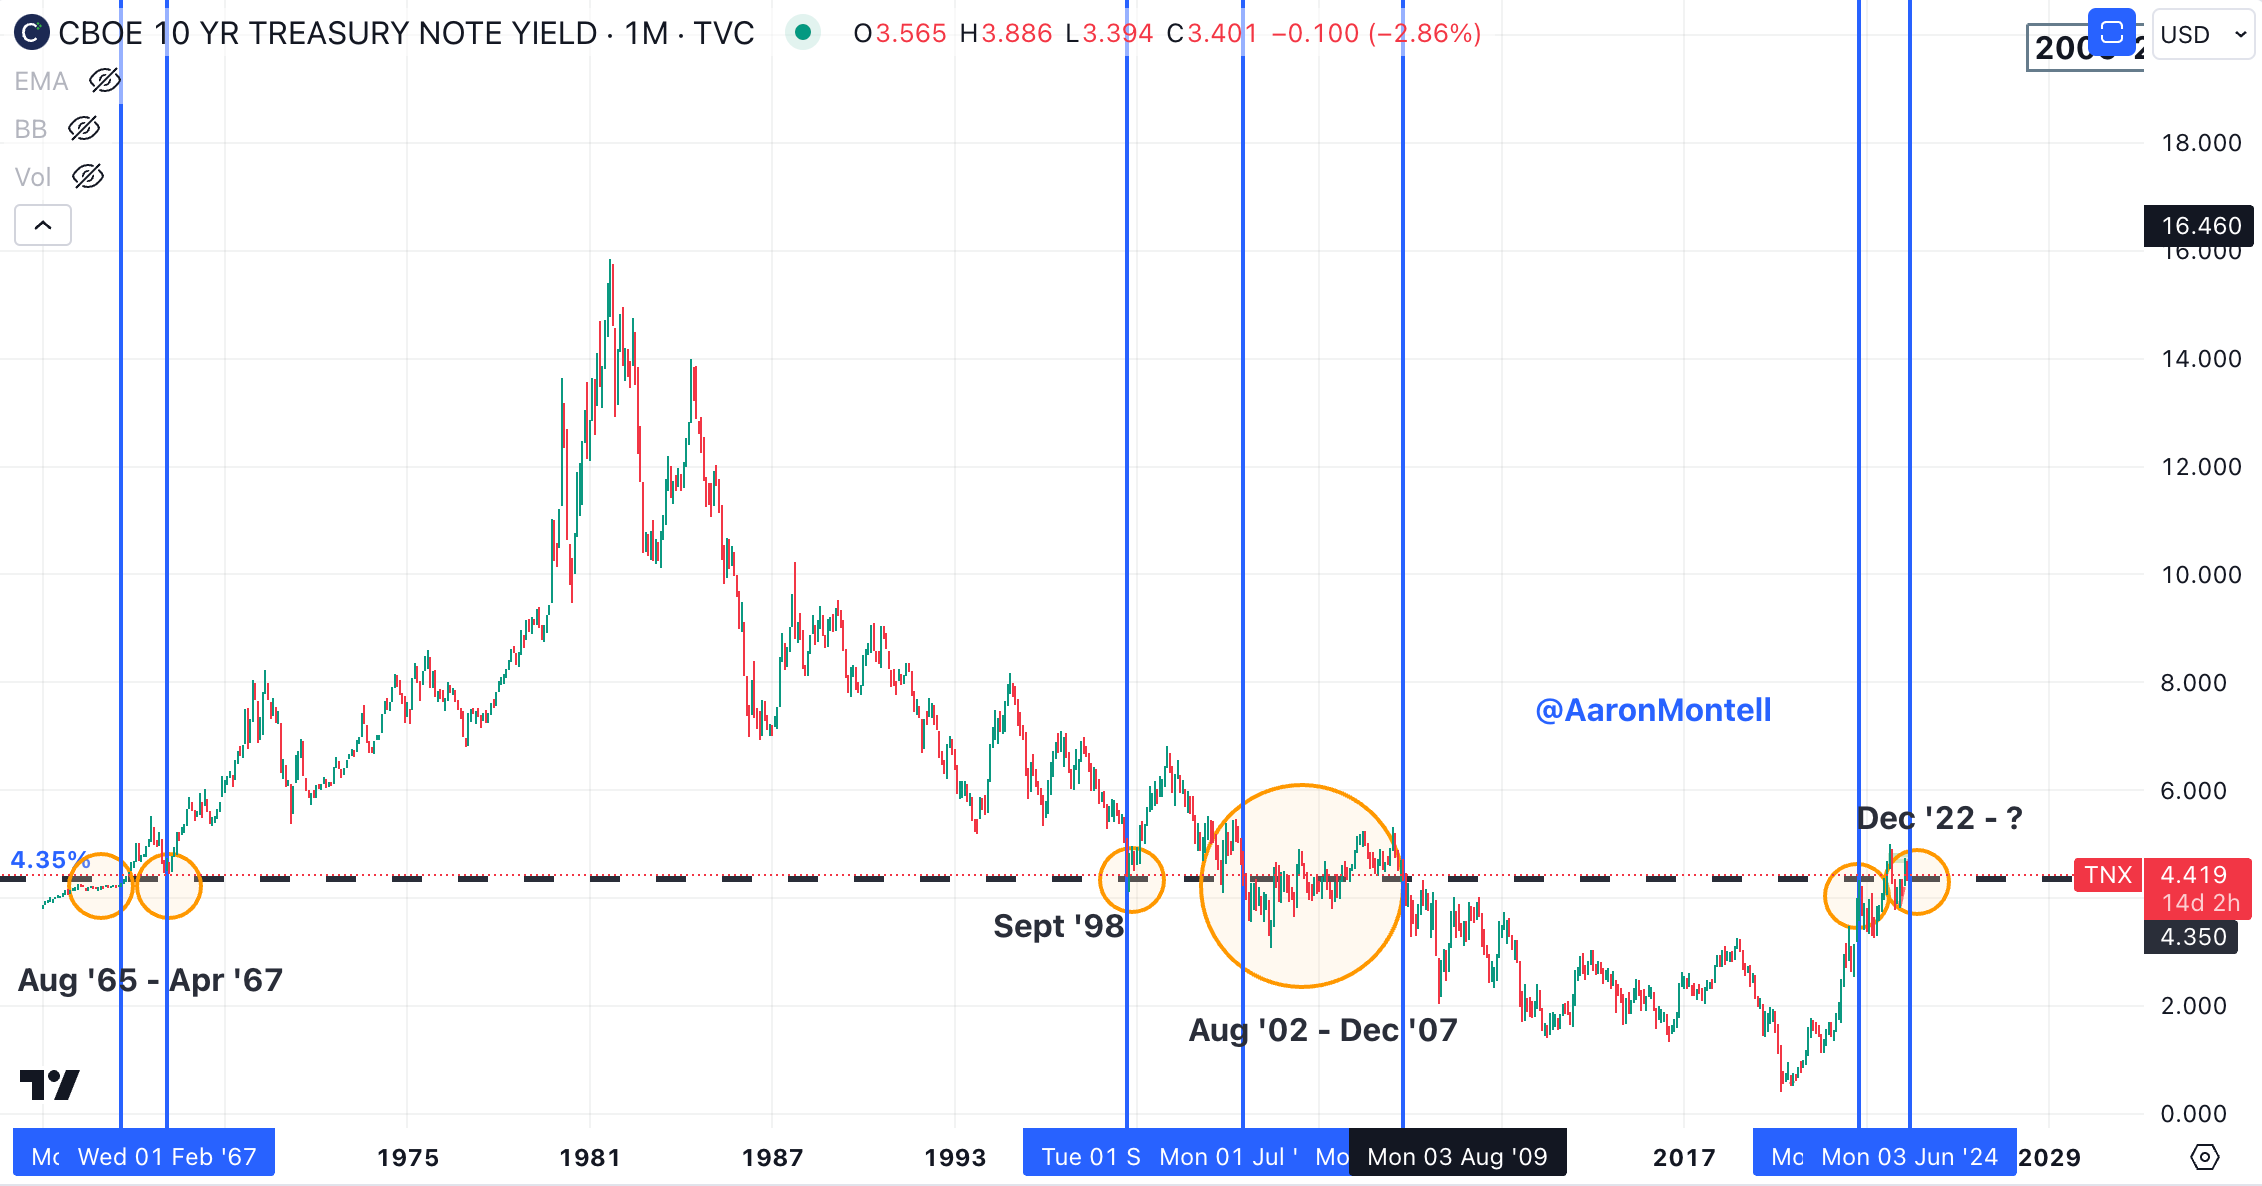
In fact, 4.35% has been a relevant support/resistance level going back to the late 1960s. You can see in the chart below how yield was initially rejected from this level in August 1965, only to break above it in April 1967. I’m guessing few knew at the time that the 10-year yield was heading to 16% in the late 1970s/early 1980s.
This same level, 4.3%, again gained attention in the late 1990s, when yield found support once again at 4.35% in September 1998. Eventually, yield broke below this critical level in August 2002. However, it was more than five years of dancing around 4.35% before a divisive move lower occurred in late 2007.
Yield has been below 4.35% ever since—that is, until recently. In October 2022, yield rose quickly to touch 4.35%, eventually breaking above in September 2023. Now, once again, this critical level is acting as support.
The question becomes, is yield destined to “dance” around this level for the next several years, much like it did in the early 2000s?
My opinion remains that we are likely to remain at these levels for longer than most expect. It seems likely to me to not only see yield dance around this level but also another leg higher for yields yet to come. The scenario I drew back on May 8th is still in play. The scenario marked in green didn’t play, but the red scenario is still very much in play. I have been writing about the open daily price gap( shaded in green below) for months, and I still believe it is likely to be filled. Also, I’m keeping my eyes trained on the 2007 high at 5.23%. If yield were to reach those 2007 levels, they should act as formidable resistance, at least at first.

Yields are following the path I have been doodling, at least for now. I practiced what I preached and locked in customer mortgage rates on Wednesday and Thursday this week as yield touched 4.3%, as I have been targeting. Now I belive risk has shifted, and the move higher will continue. I would expect yields to continue to rise and test the broken diagonal trend, somewhere around 4.6%. Recapturing the trend would lead to a continued move higher and likely a return to the open daily price gap at 4.7% - 4.8%. If it’s lower yields you want, then you want to see the open price-gap completely filled before yields turn lower.
Mortgage Locksmith Report
I believe yields will continue to move higher. It will be important to see how they react when they arrive at the levels I mentioned above. The first level of importance is around 4.6% (the broken diagonal trend line). For the coming days, at least, I will have a locking bias.