


It’s been a tough couple of weeks for anything or anyone sensitive to bond prices, particularly mortgage rates. The 10-year Treasury rose by more than 100bps (1%) since April 9th. The March CPI (Consumer Price Index) was the match that reignited higher yields. Since the April 10th release date, yields have been higher 6 of 10 trading days. At the same time, the US Dollar has strengthened to levels not seen since the Fall of 2022, and equity markets have suffered a very mild pullback of roughly 3%-5%.
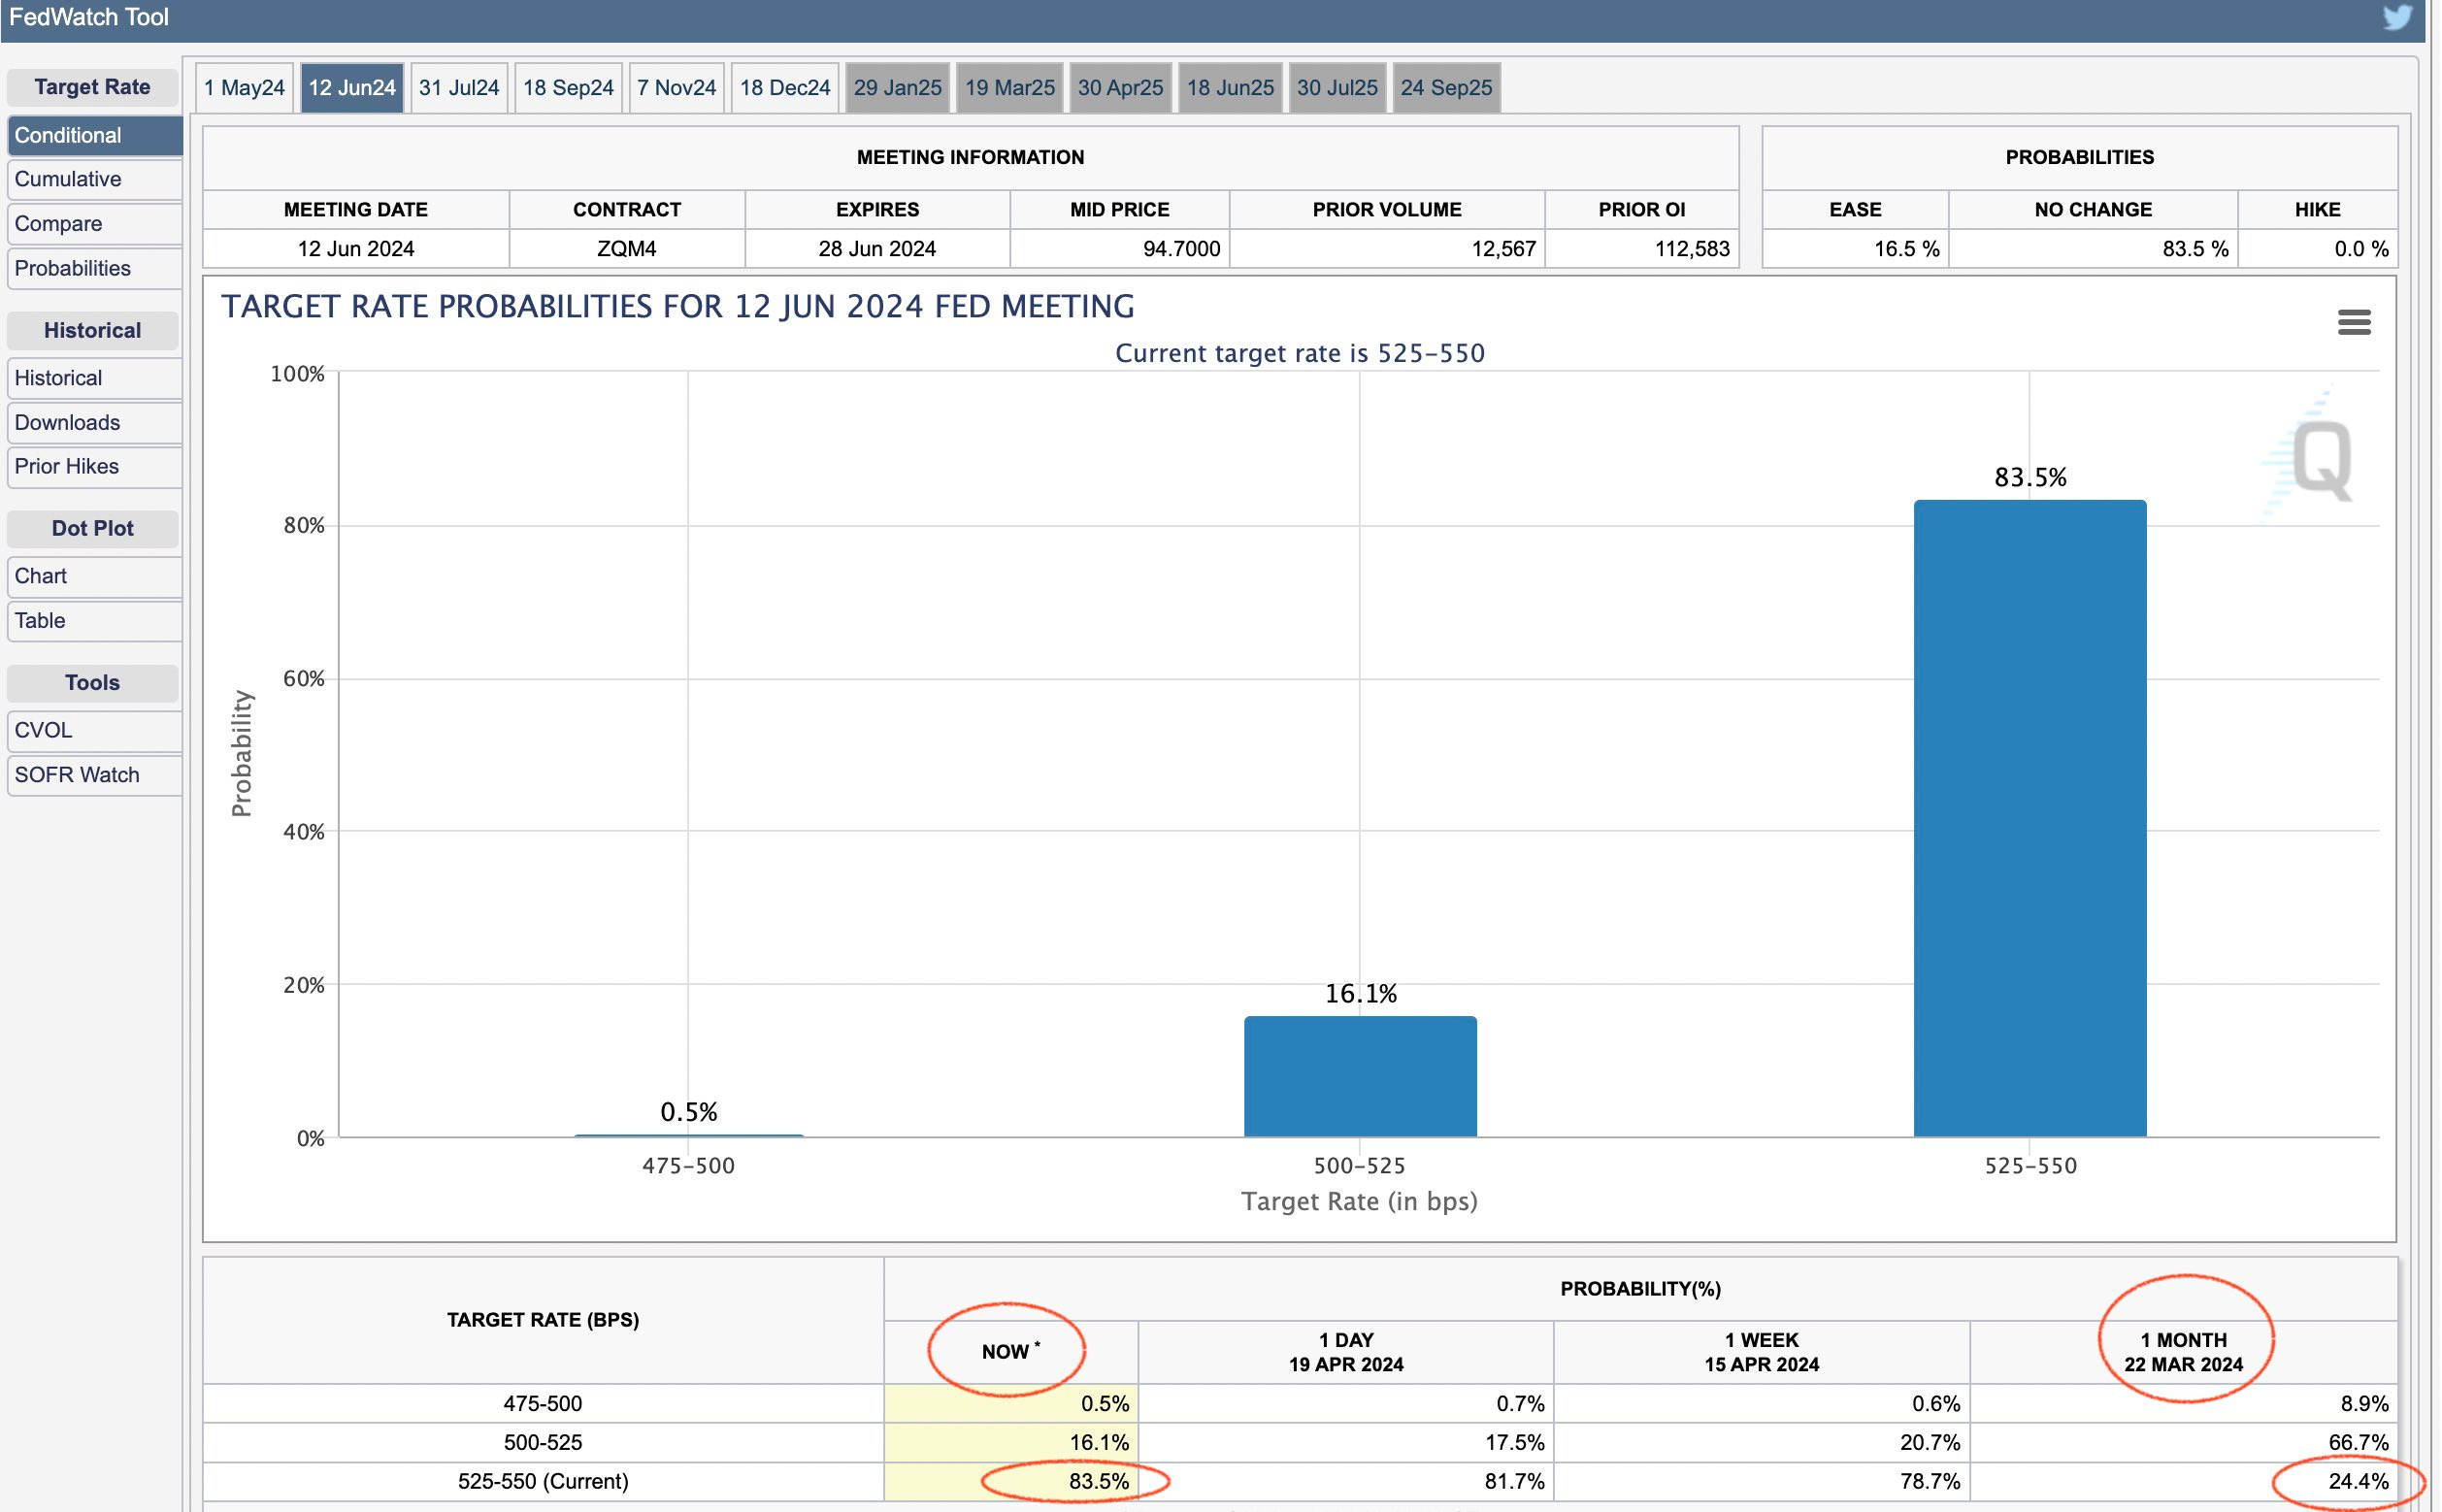
During that same period, market expectations for future FOMC (Federal Open Market Committee) rate cuts have been repriced. According to the CME Fedwatch tool, one month ago odds were more than 75% that the Federal Funds (FF) rate would be cut at or before the June FOMC meeting. Now those odds are 83% that FF remains unchanged at 5.25% - 5.5%.
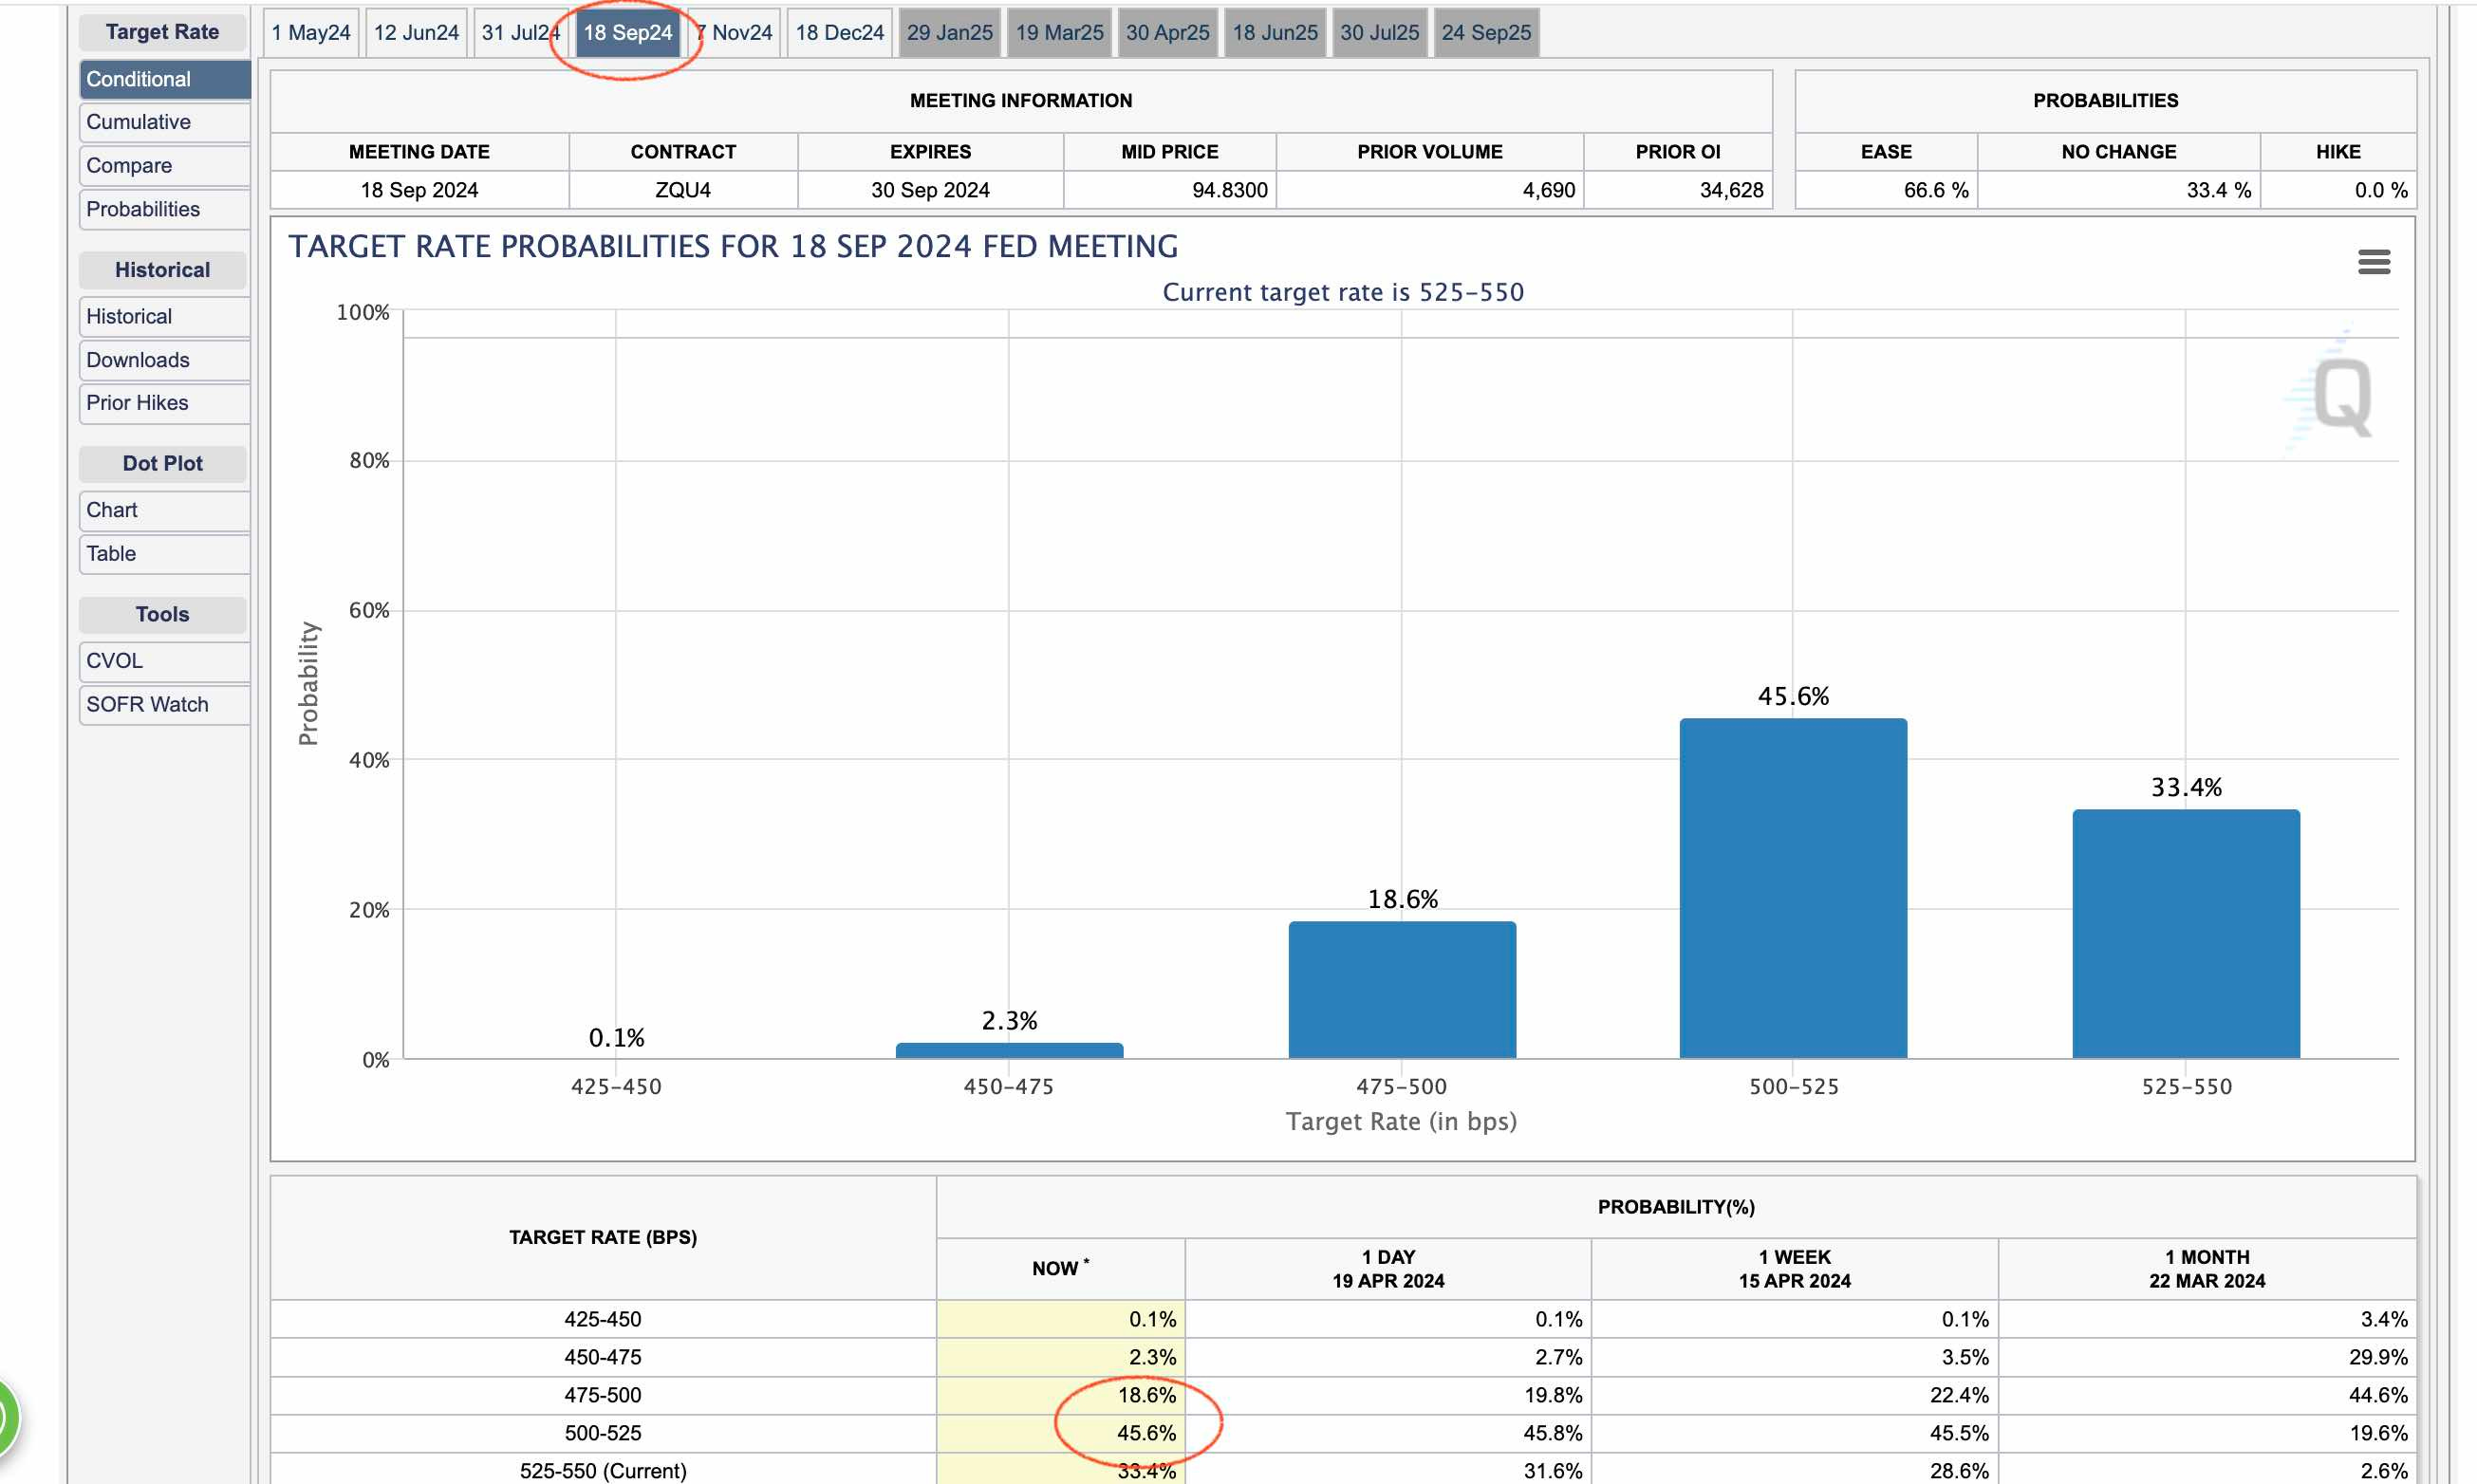
Now, the next FOMC meeting with better than 50% odds of a rate cut is September.
As an aside, I am finding it more and more difficult to imagine a scenario where rates are cut at all in 2024, and if by chance they are cut, I wouldn’t expect it until November at the earliest.
The result of these changing expectations has been higher yields, higher mortgage rates, higher dollar, and lower equities.
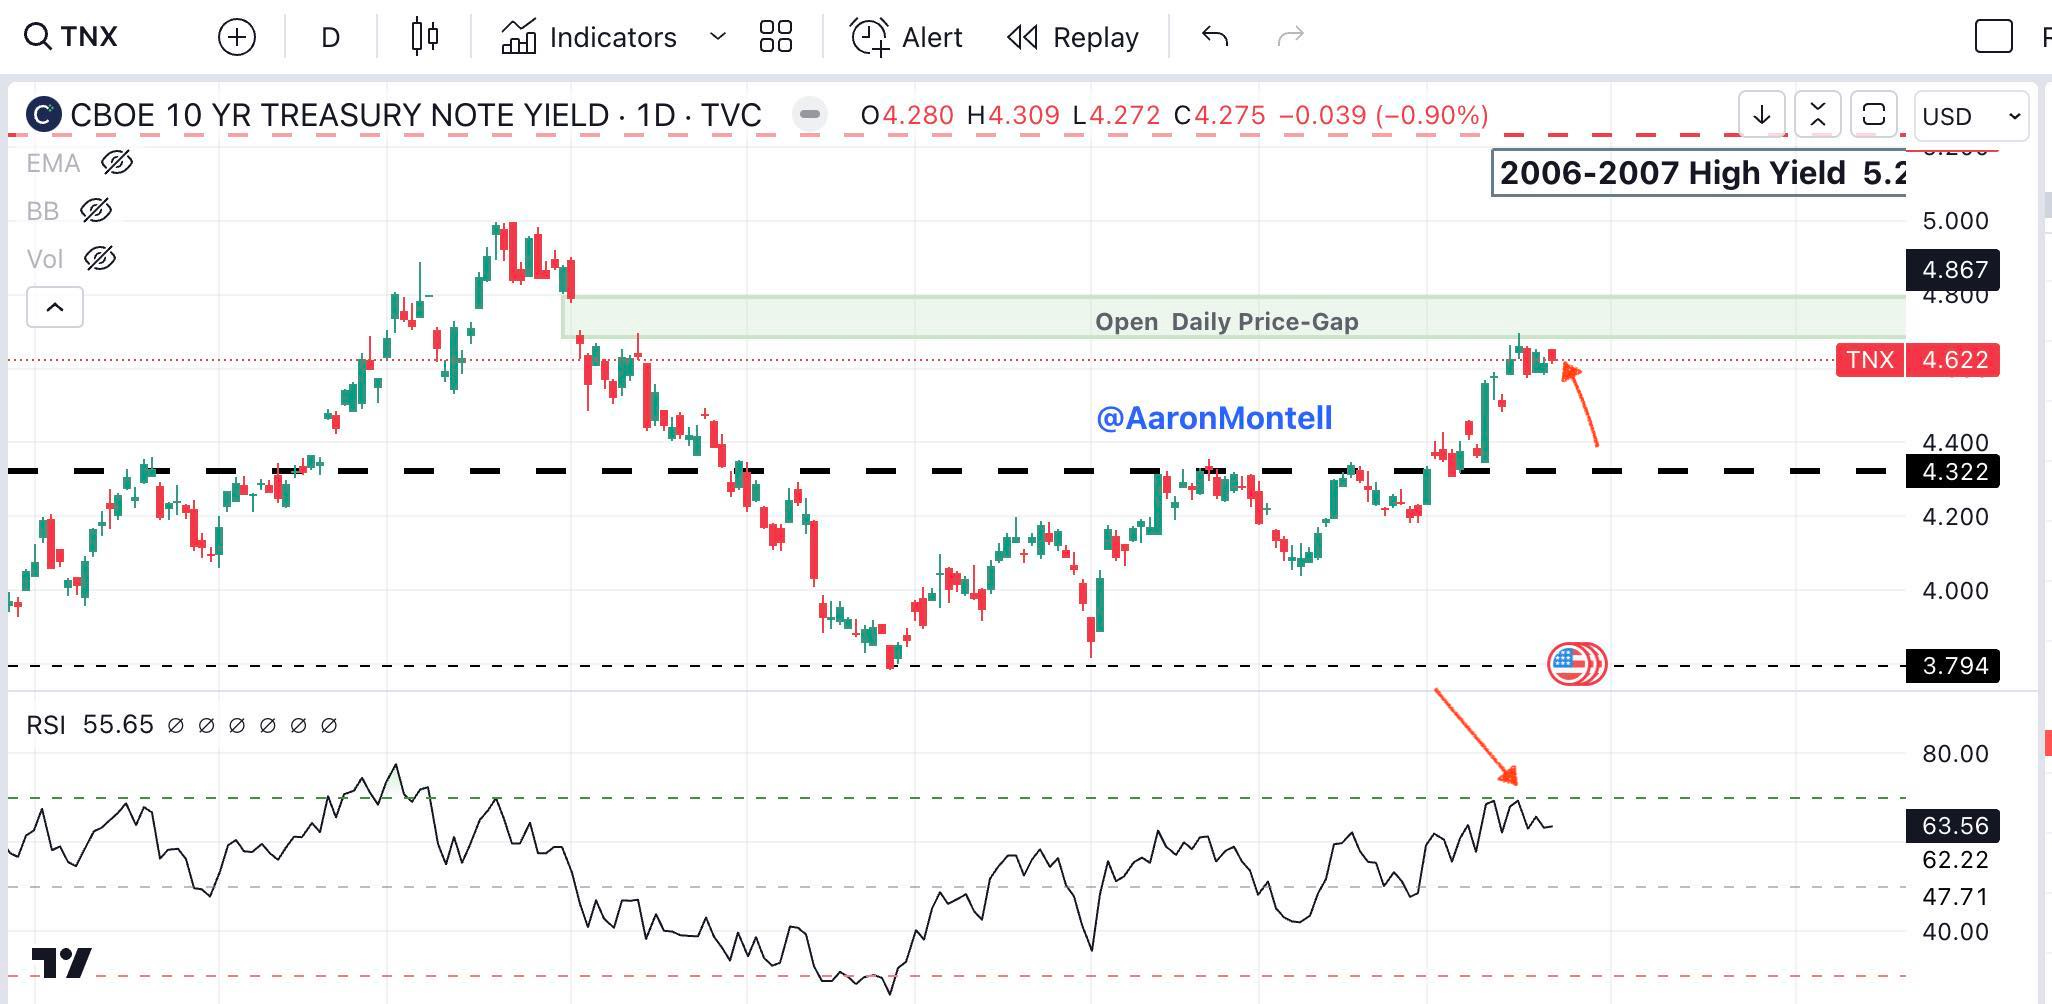
The yield on the 10-year Treasury has risen sharply since April 10th, running as high as 4.7%. For those who have read any of my previous material, I have been watching this level for months as a likely spot for yields to retrace due to the open price gap that formed on November 2, 2023. As I have mentioned many times, these price gaps are almost always filled, the question is when.
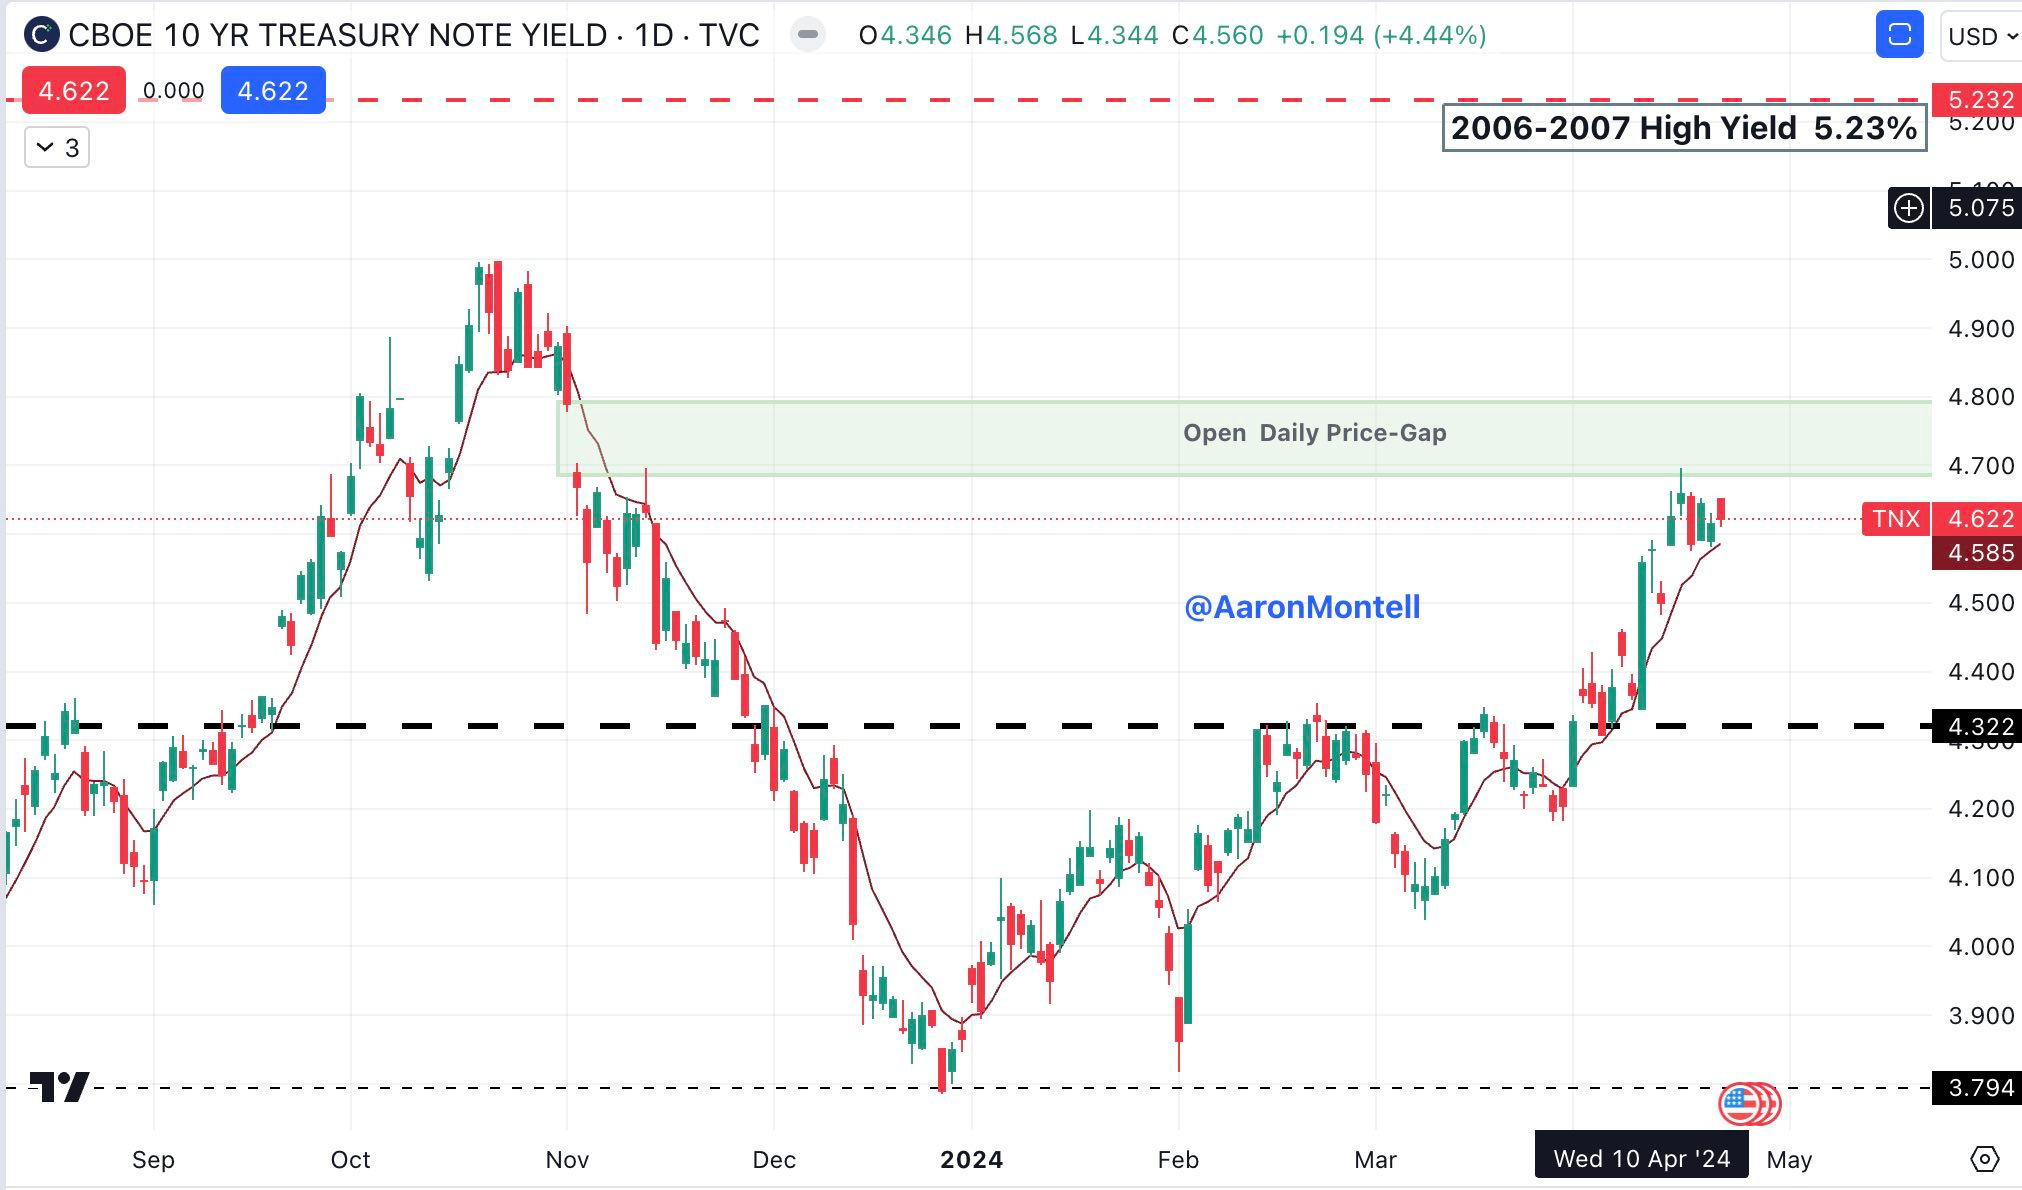
In the most recent rally, yield touched the lower line of the open gap and reversed. At some point the next few months I suspect that the gap will be filled completely, as yields will retest the Fall 2023 high of 5%, and may go as far as retesting the 2006-2007 high of 5.23%. However, we all know these things rarely happen in a straight line; the following is my argument for a short-term period of slightly lower yields. Short-term, in this case, is meant to mean several weeks.
The world financial system is interconnected - currencies, equities, and debt markets from around the world all interact. Often these relationships can provide insight into what is happening below the surface, and more importantly, what might happen next, and how it would likely affect mortgage rates.
For the sake of brevity, I won’t explain the relationships highlighted in great detail; that is something that can be researched by those interested.
Currencies
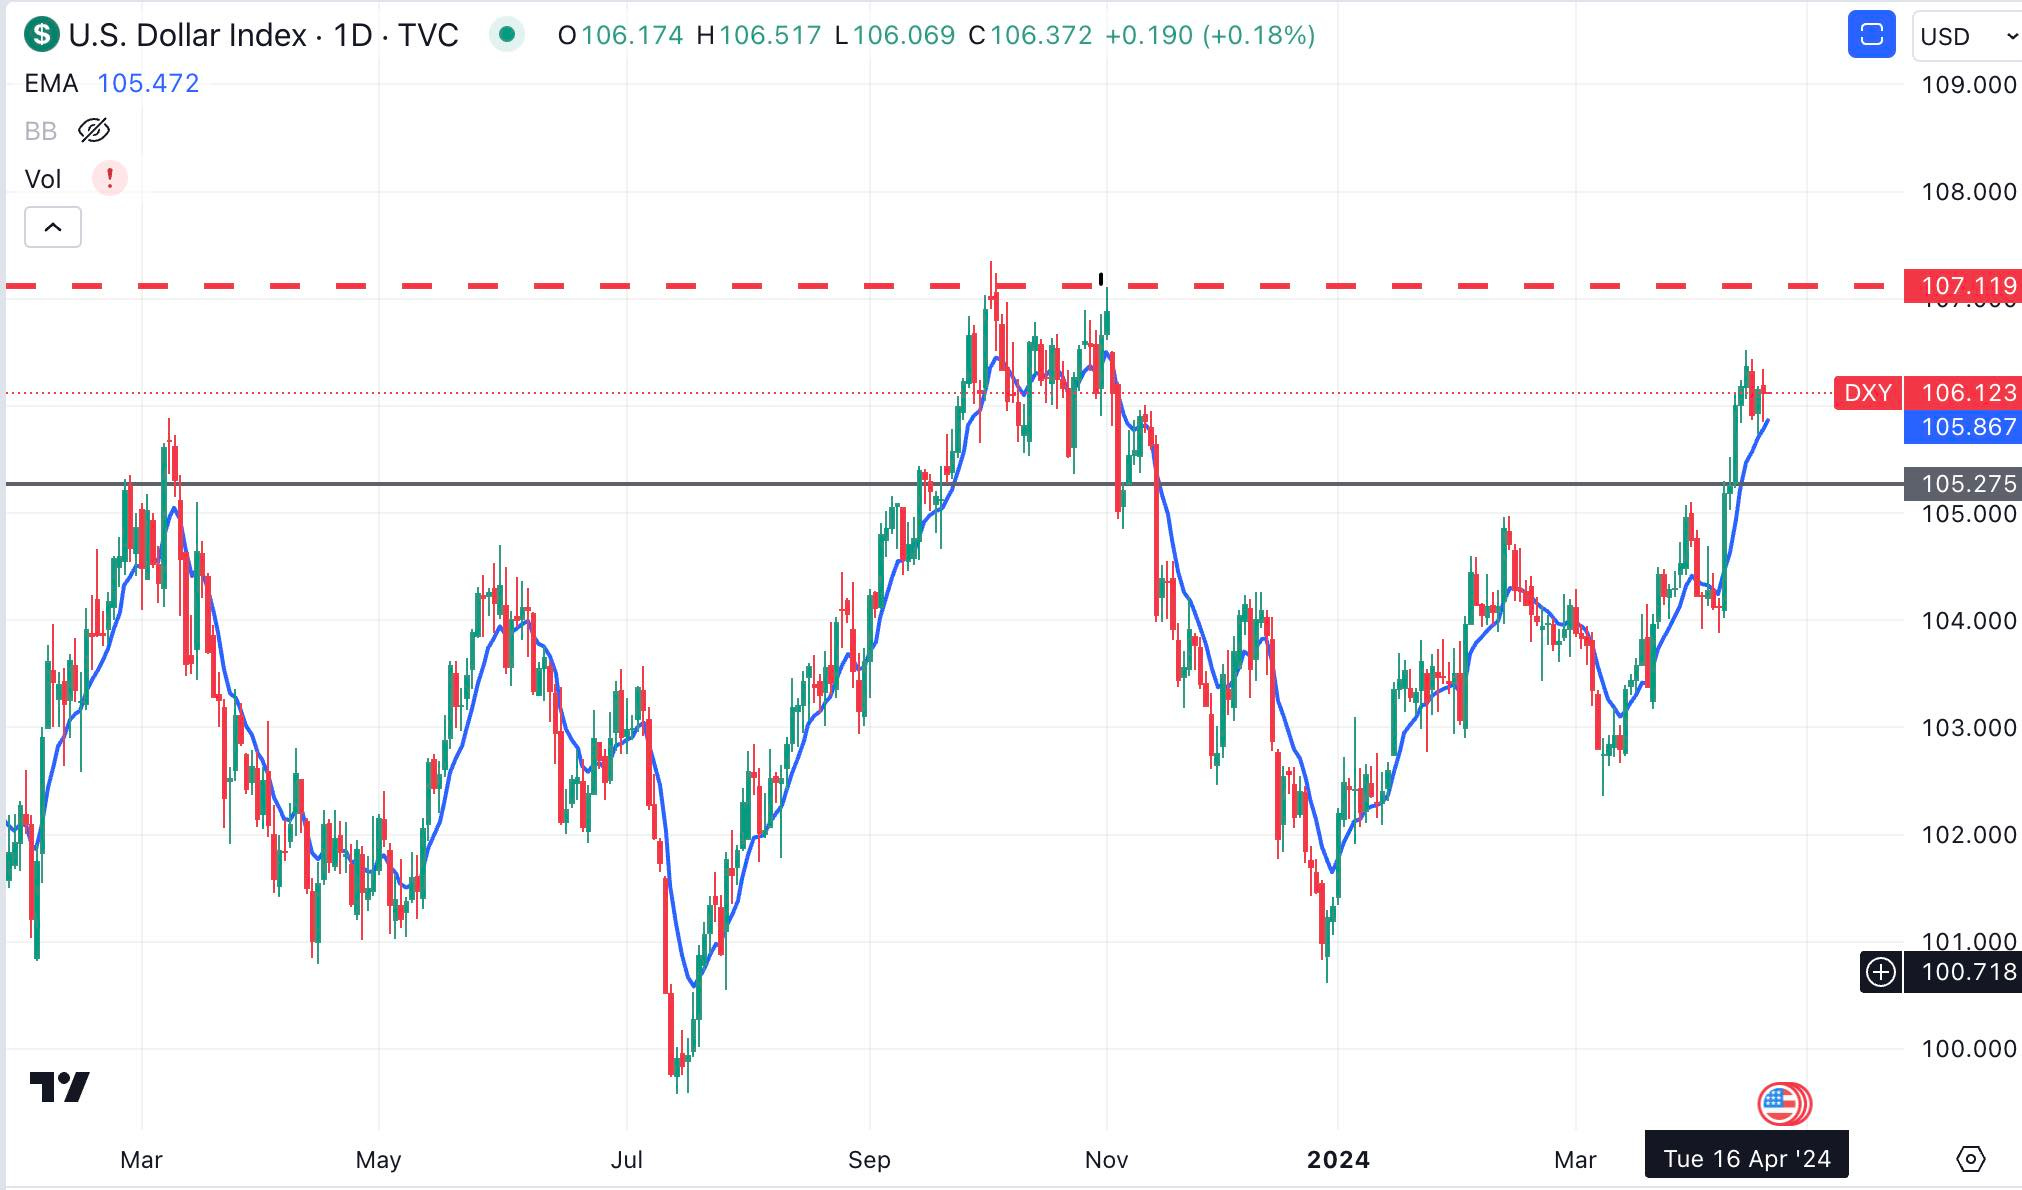
The US Dollar has risen quickly but is yet to match the most recent high from November 2023. Remember, trends are defined as higher highs and lower lows As long as a new high isn’t established, technically the trend is still down.
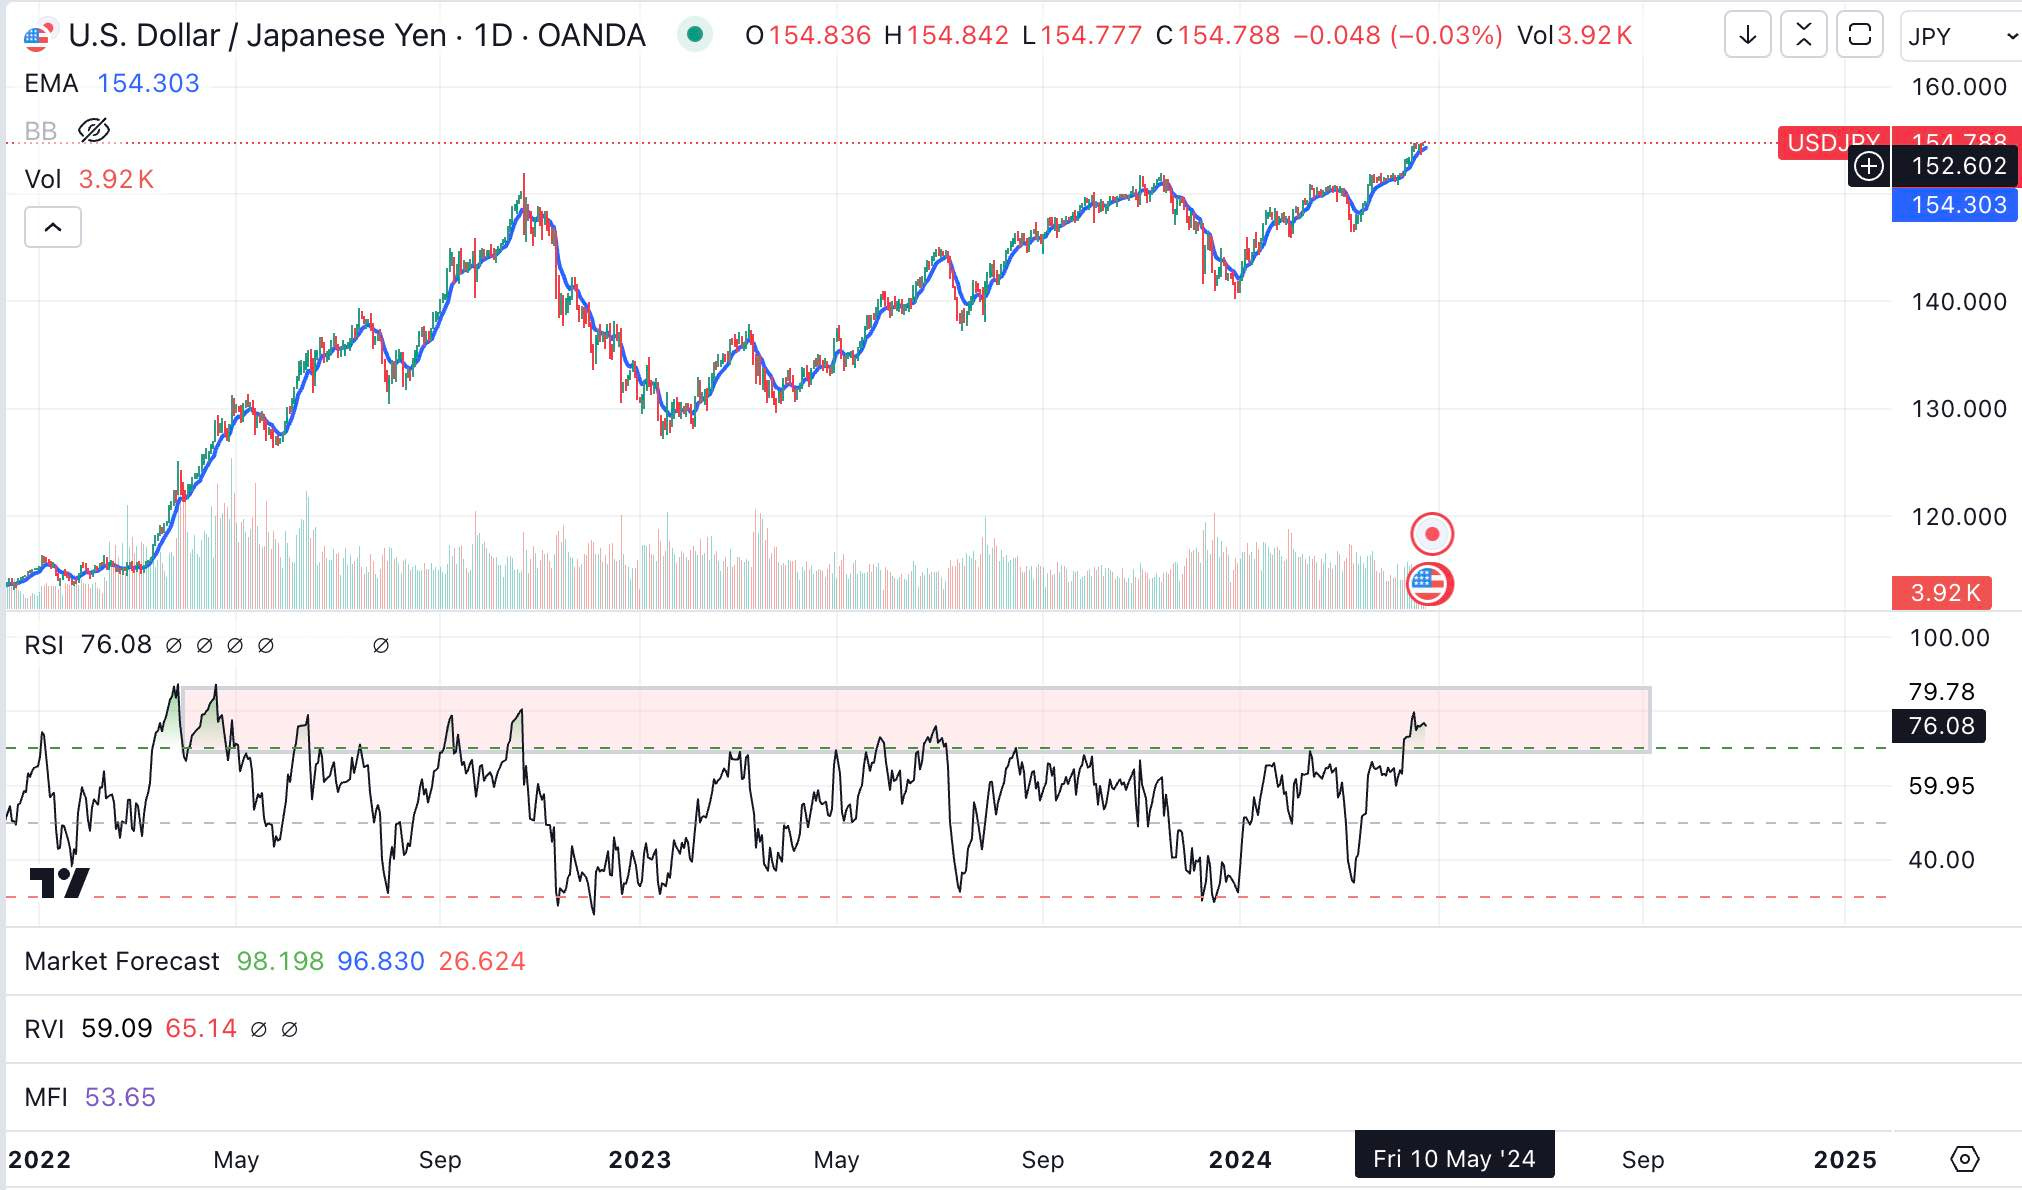
Of course, currencies are measured on a relative basis. One of the most important currency pairs is USD/JPY - US Dollar/Japanese Yen. Despite the Japanese hiking rates in their country for the first time in many years, the Yen has fallen off a cliff vs. the USD. The USD/JPY is the highest it’s been in more than 20 years.
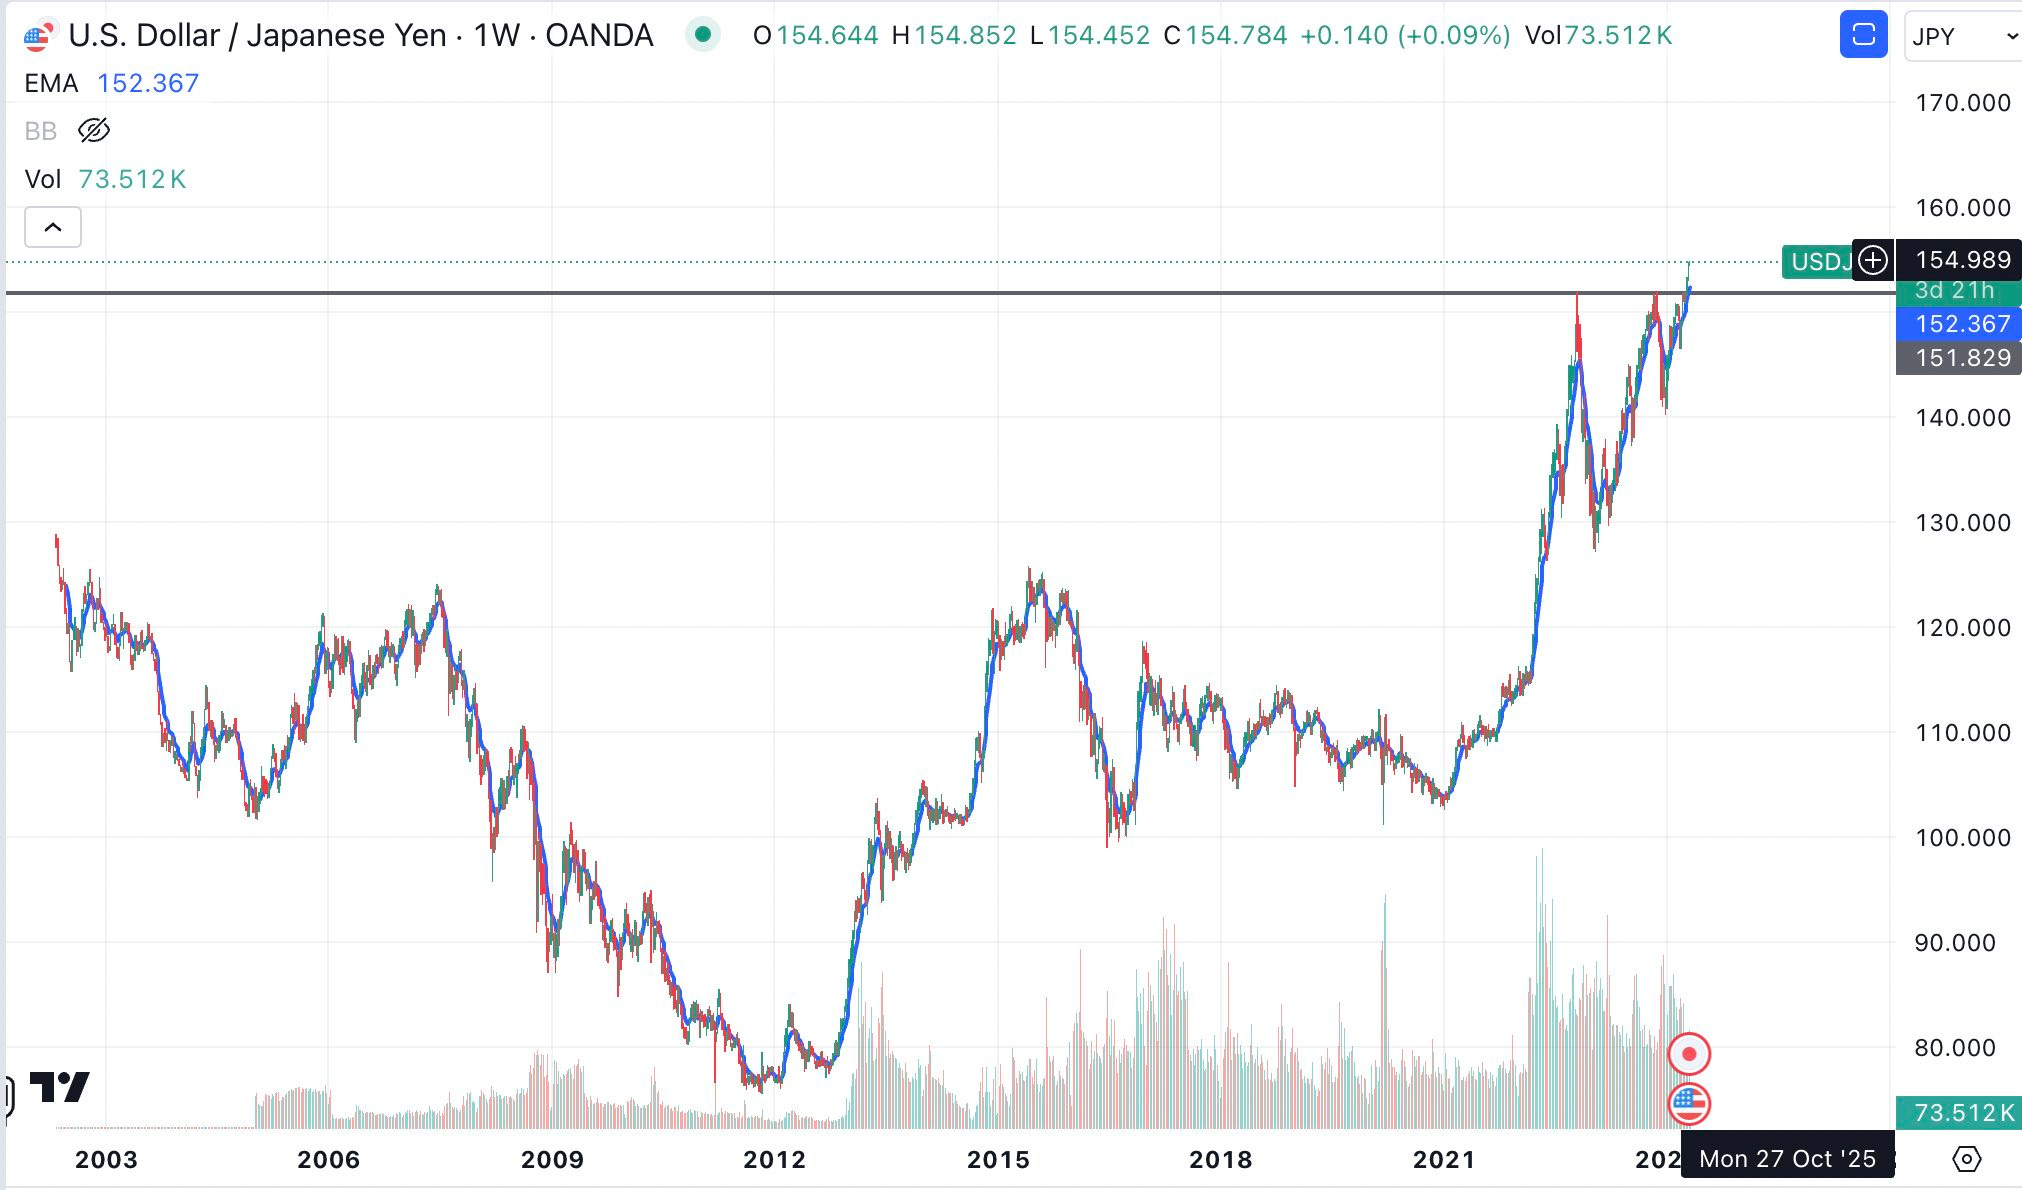
However, the move may be running out of steam. Using the RSI (relative strength index) as a measure of momentum, USD/JPY is well within the “overbought” zone, which indicates slowing Dollar strength relative to the Yen, which historically has led to some selling.
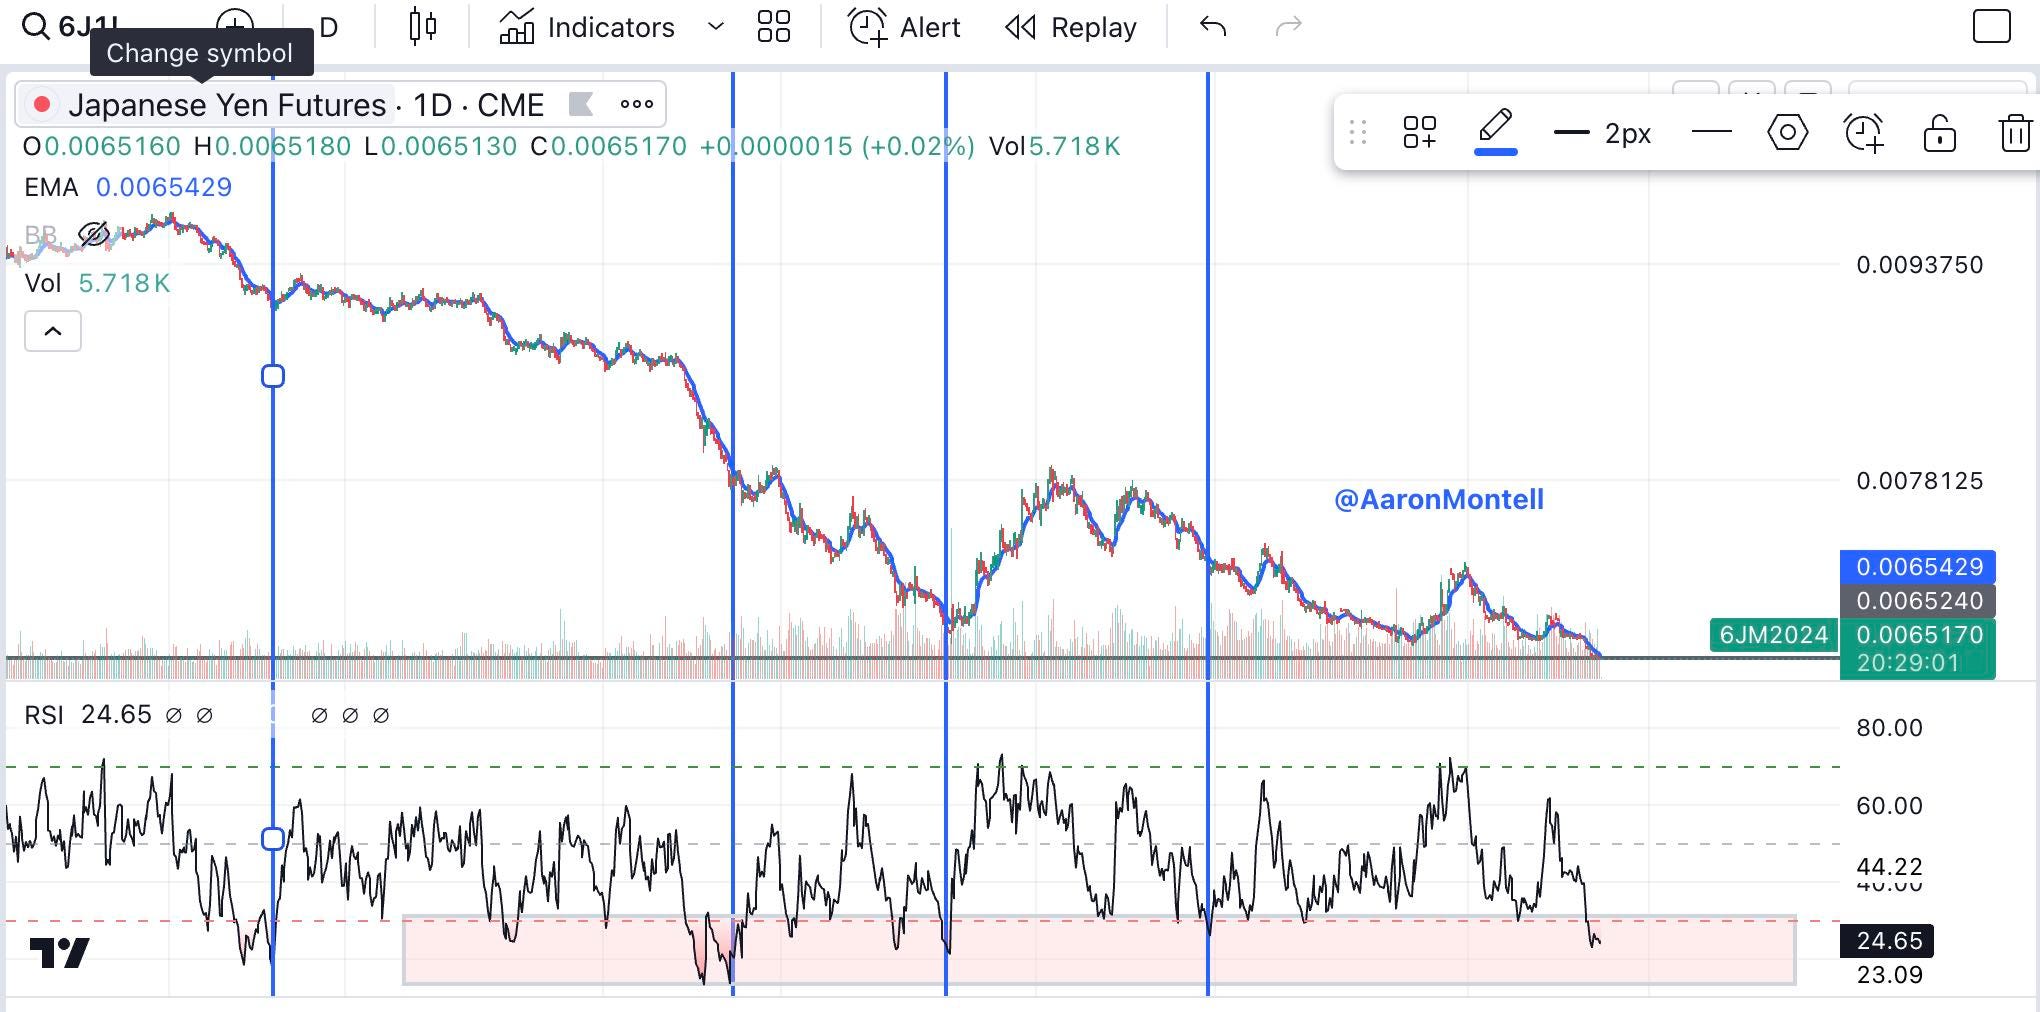
As you might expect, the JPY is thus “Oversold”, as shown using the current futures contract (/6J), which historically can lead to rallies, however long- or short-lived they may be.
The historical relationship between the Japanese Yen and yield on the 10-year US Treasury, as measured by the $TNX, is clear. A stronger Yen will be friendly for a lower 10-year yield and by extension lower mortgage rates.
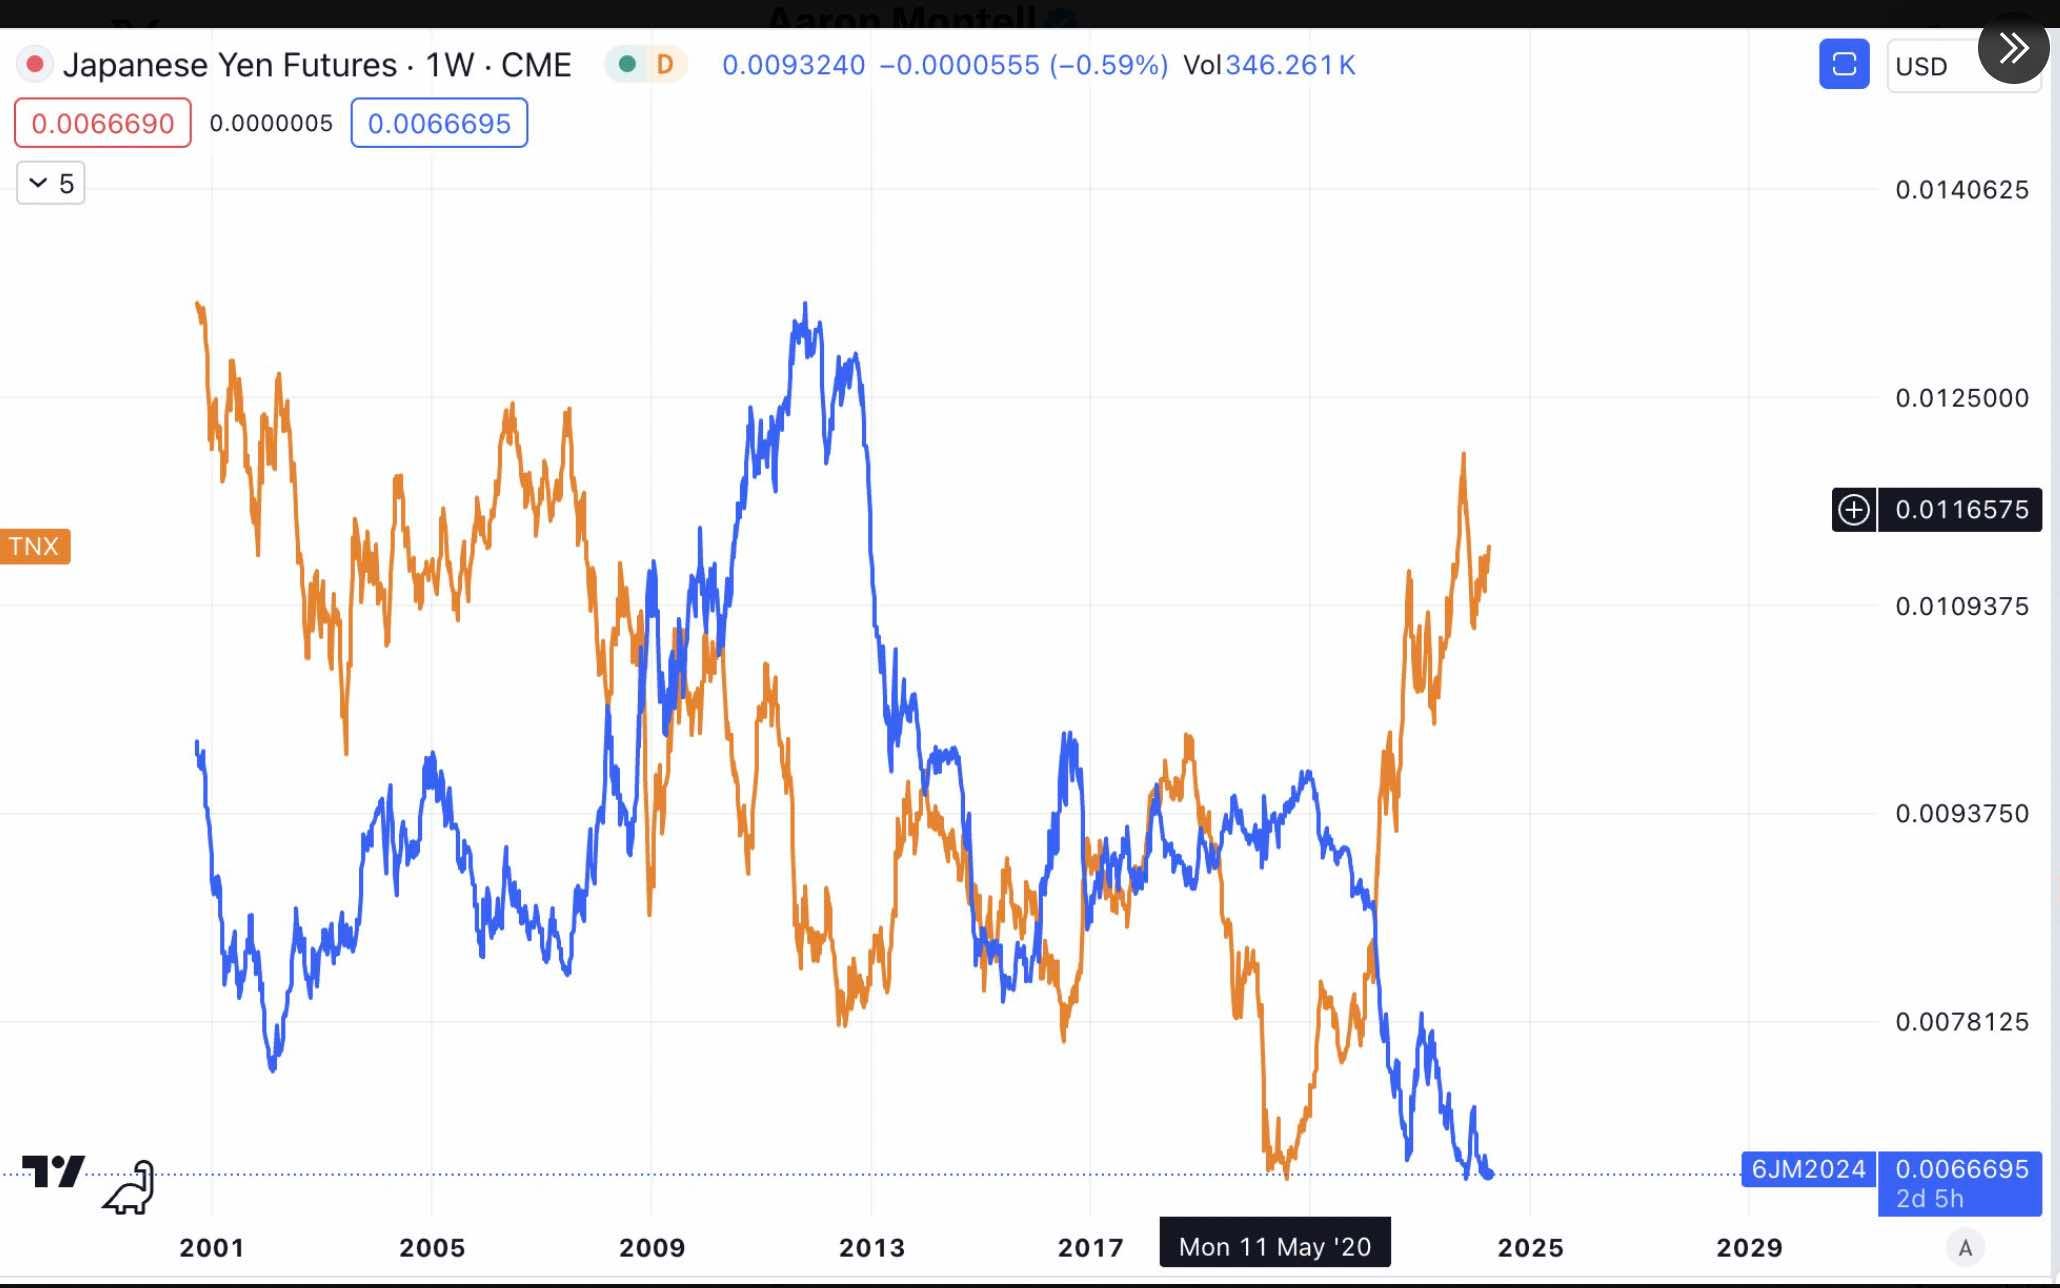
The takeaway is that a weaker USD and stronger Yen are favorable to produce lower yields and lower mortgage rates.
Equities
The Q1 rally is taking a breather, and it’s a good thing. Whether or not the rally resumes and produces new all-time highs, I can’t say. I also can’t say that this pullback won’t eventually produce something more substantial to the downside. So far, the $SPX is down a mere 4.5% from its most recent high. Whatever the next move is, these things rarely happen in a straight line without some exogenous, unforeseen event - i.e., Covid-19. Barring such an event, new lows or new highs should be a process. Why is this important for bonds, and mortgage rates? Recently equities and bonds have formed a positive correlation.
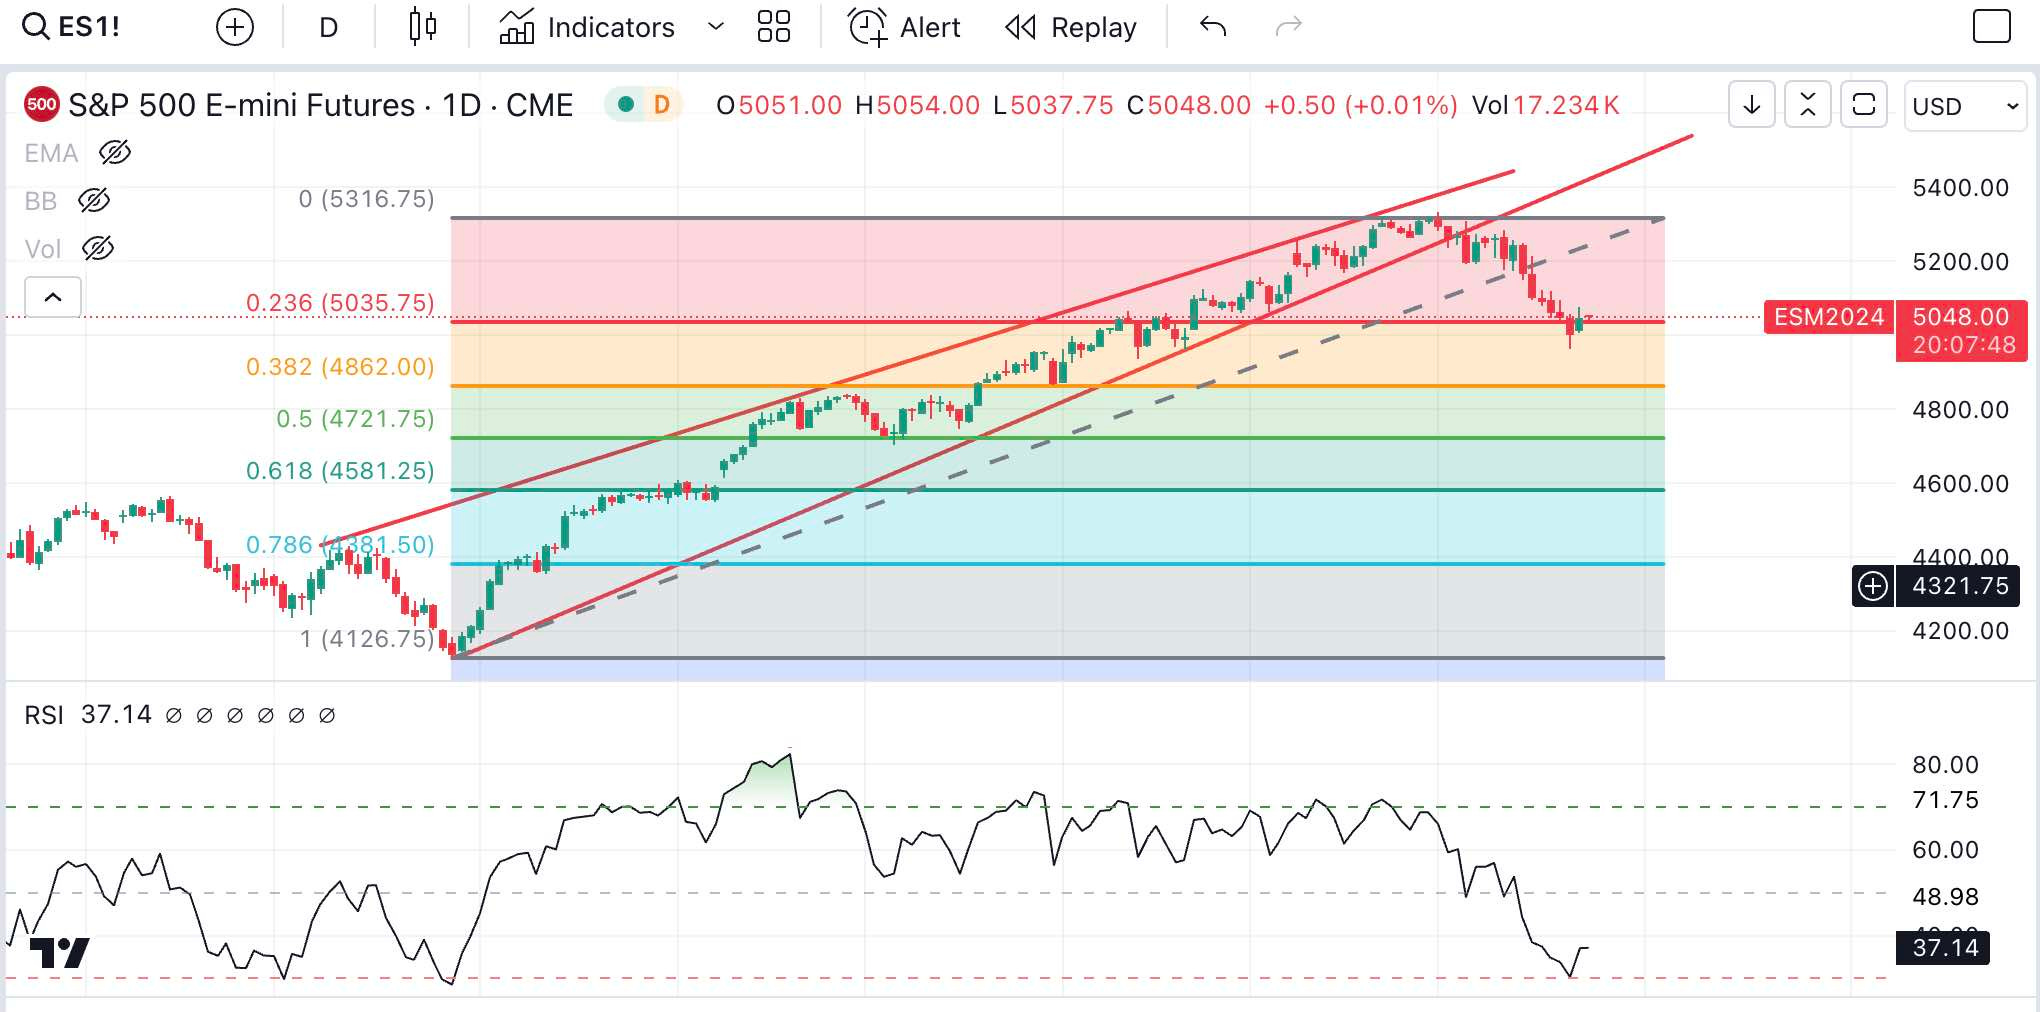
The image below plots the $SPX against the /ZN (10-year treasury futures). Remember that bond prices and bond yields move inversely, so as /ZN falls the 10-year treasury yield rises. If /ZN were to rally with $SPX, the result would be lower yields and lower mortgage rates.
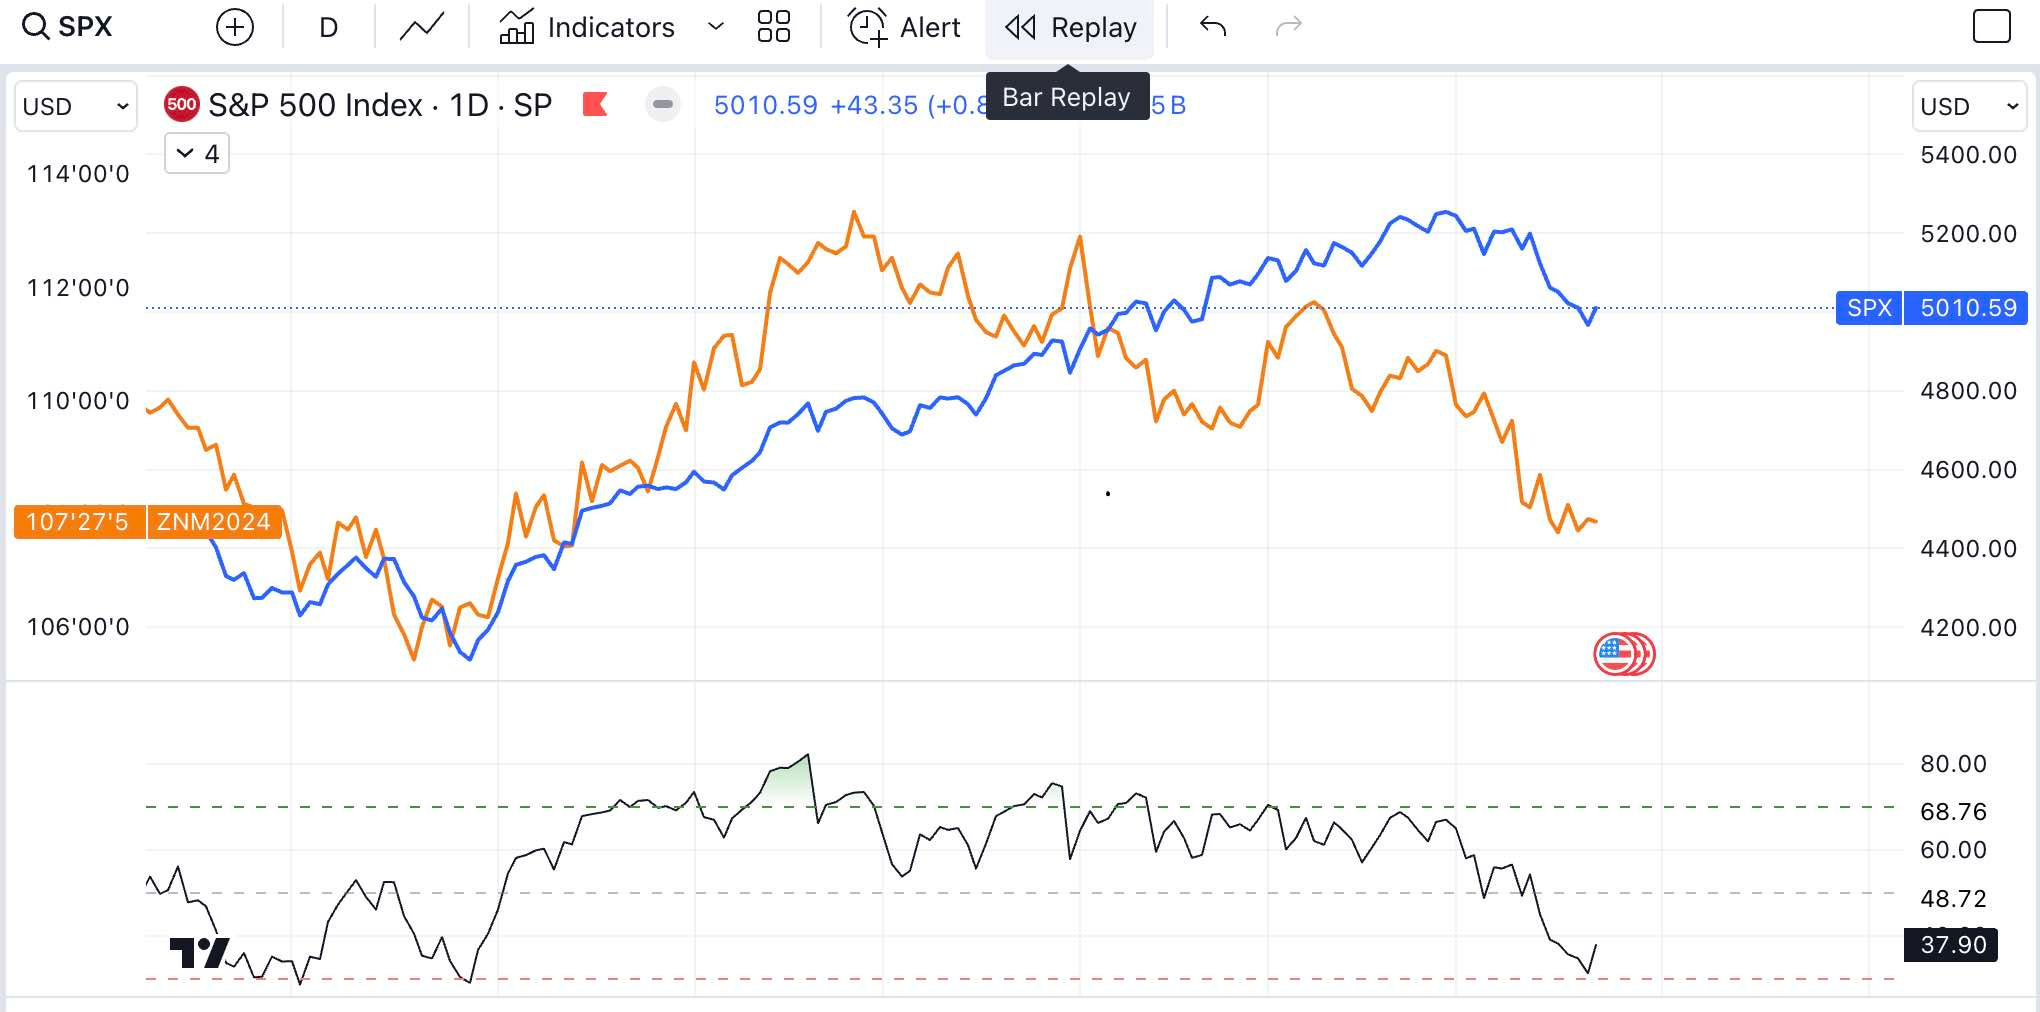
With that context, the $SPX has fallen to a technically relevant level. The recent pullback found support at the Fibonacci .236% retracement, while at the same time, the RSI turned higher. This could be interpreted as a decent spot for a relief rally. There are no guarantees, only probabilities. Since equities and bonds have been moving together, assuming that the relationship remains intact, both should rise together.
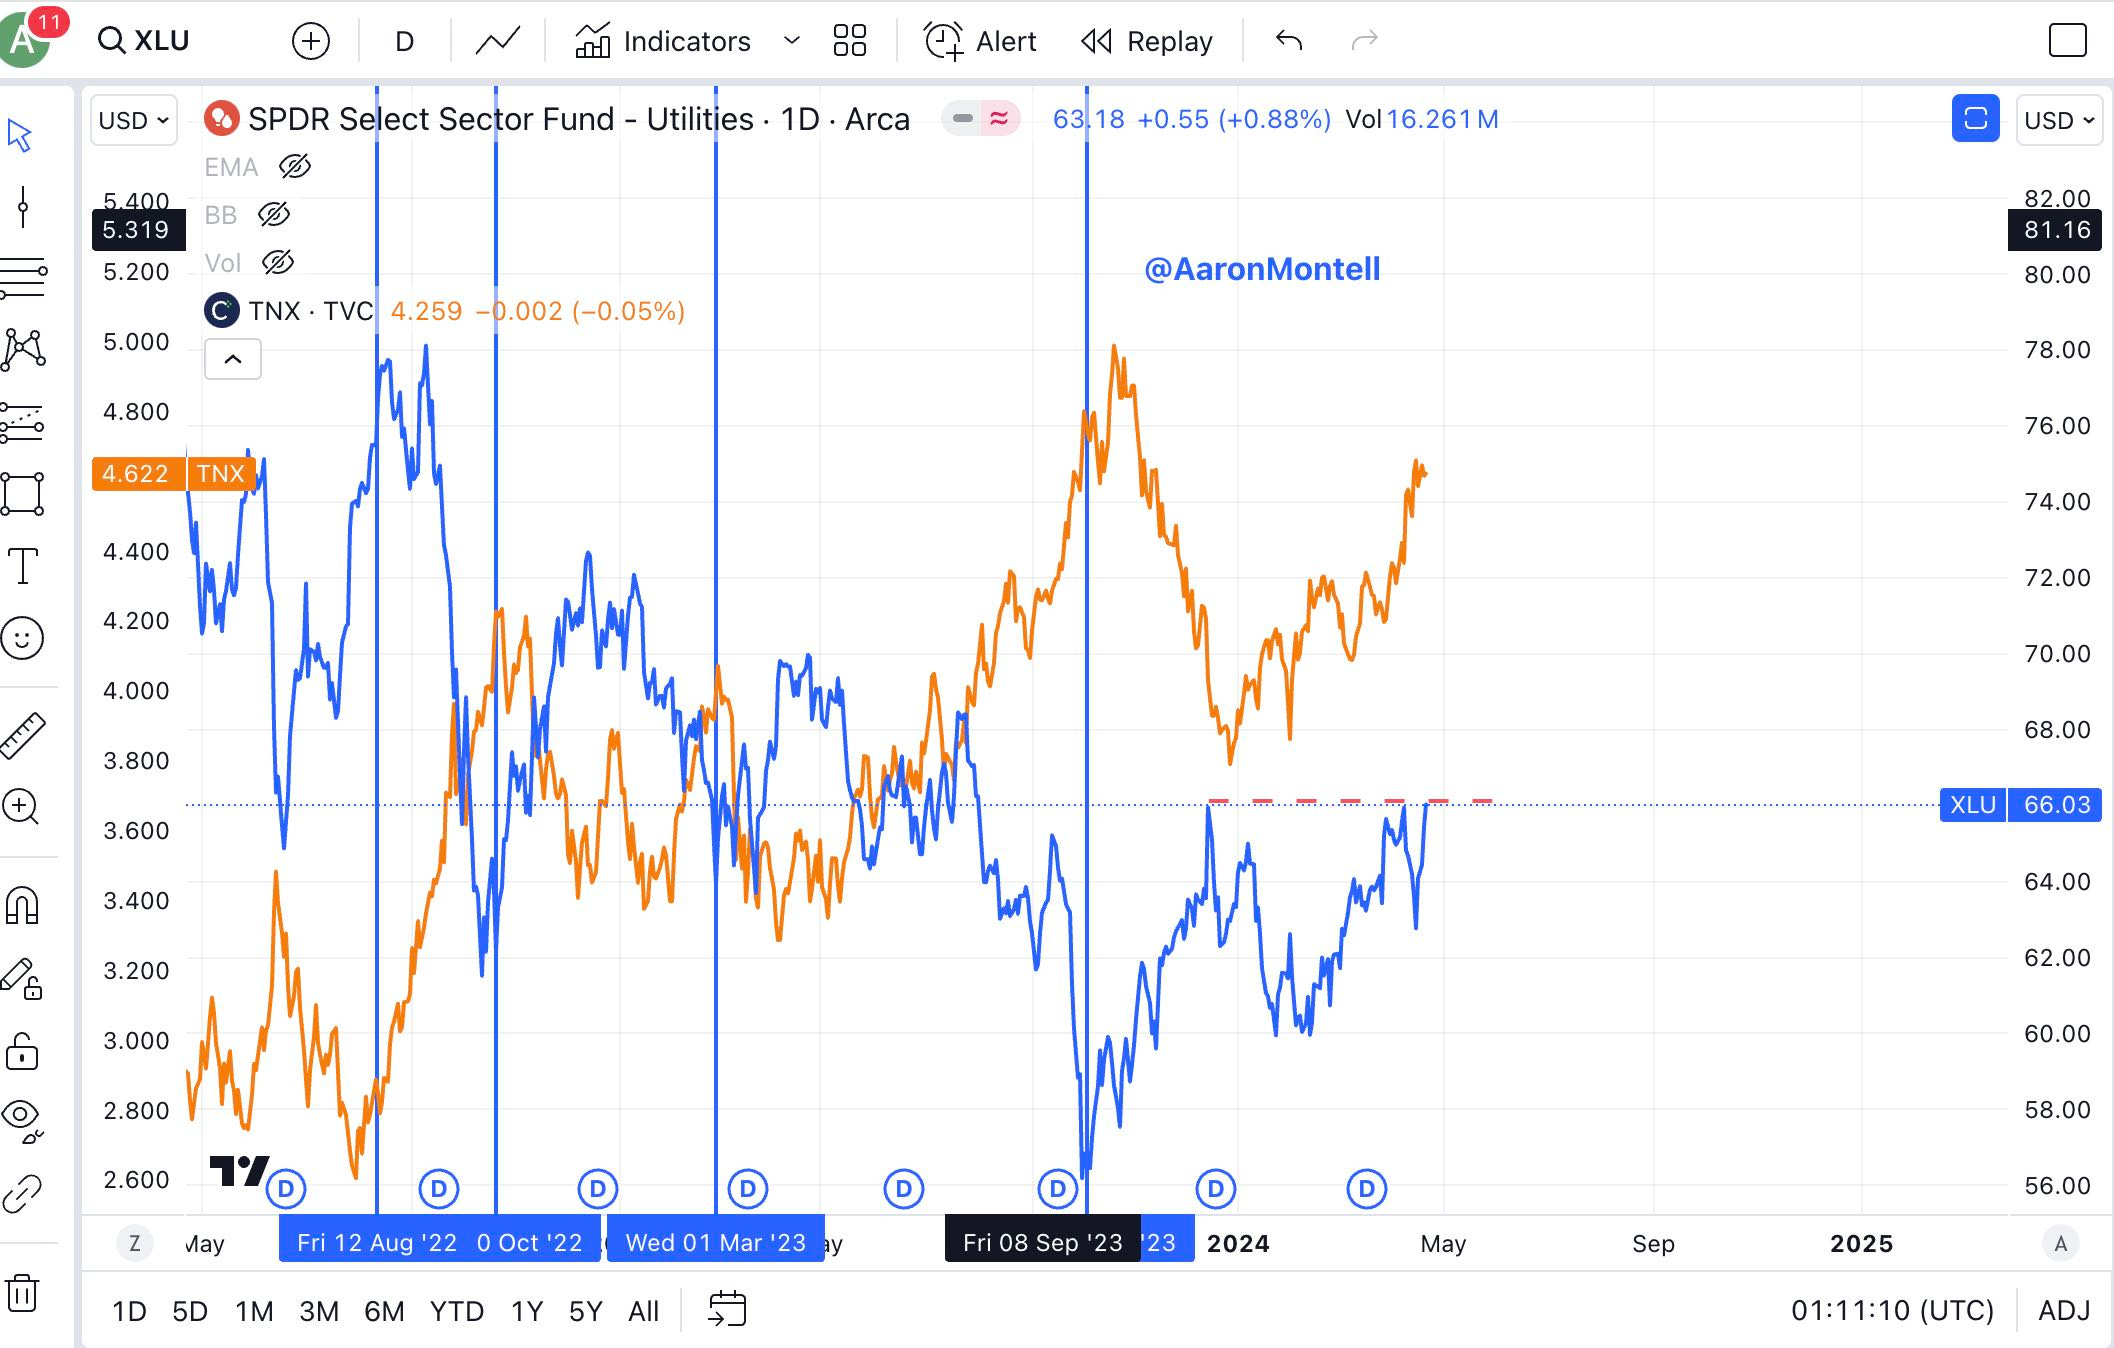
The last point regarding equities and bond relationships involves the utilities sector of the S&P. Utilities are often thought of as a yield replacement since the XLU ETF yields roughly 4%. Again, it’s not perfect, but the relationship is clear, utilities (shown using the ETF XLU) and 10-year yield have an inverse relationship.
I’m watching to see if XLU can break above $66.03 and the 10-year yield follows through to the downside. For what it’s worth, the sharp reversal seen in XLU last week coincided with the high for the week on $TNX.
It’s fair to mention the XLU is also thought of as a “safety trade” meaning that in times of volatility, it’s a relatively safe place to park capital. Given the geopolitical events of last week, that could certainly be a factor here. However, XLU above 66.03 will be yet another development that would foster a favorable environment for a slightly lower yield.
Bond Technicals
I have been tracking the technicals of the 10-year treasury for years. Back in February, I pondered the possibility of future moves in the 10-year yield.
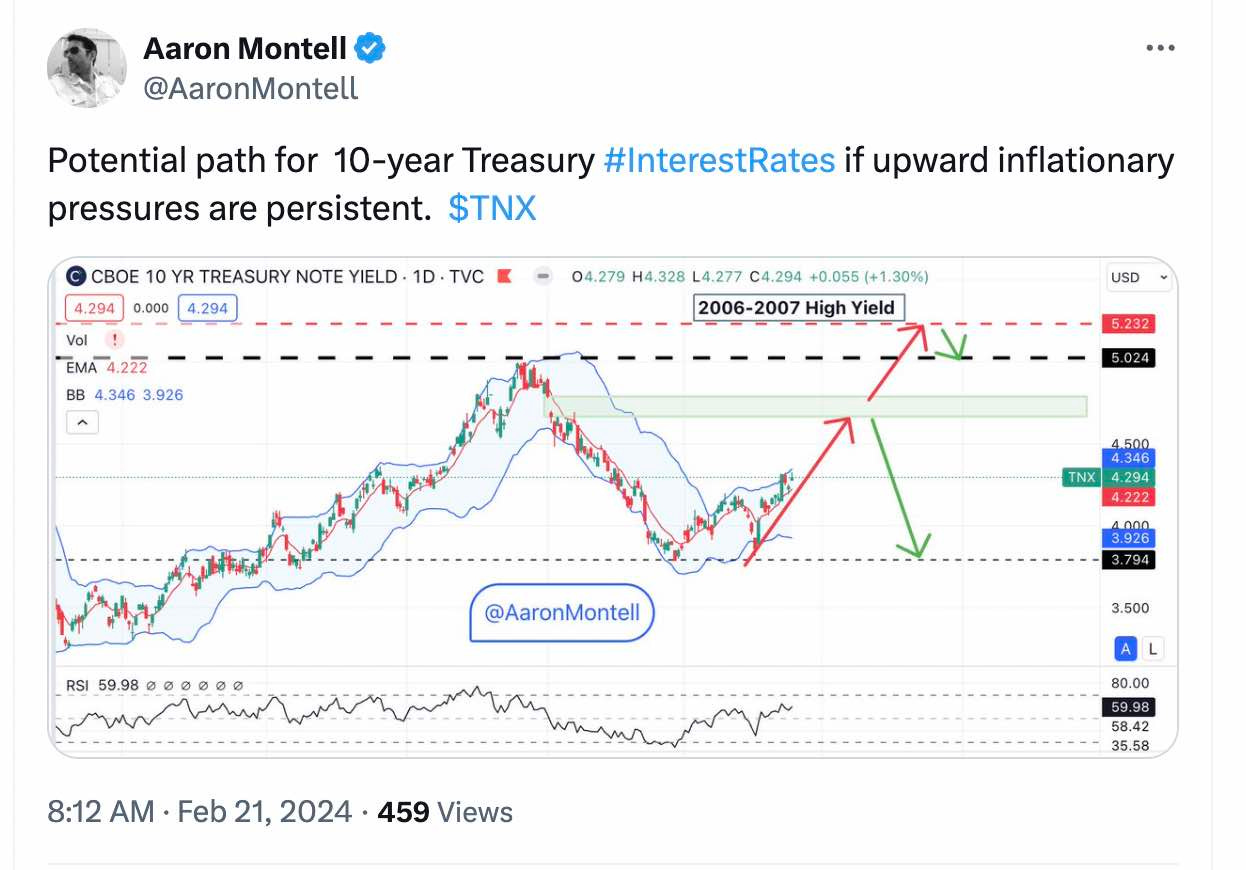
And now…
Not bad.
The open price gap served as resistance to this move, as the RSI turned lower. Both are encouraging signs that yields may be ready to move a bit lower.
I’m now doubtful of a retracement below 4%, probably somewhere just above 4%. The area around 4.2% - 4.3% is more realistic at this point. I currently believe there is a strong chance yields revisit the 2007-2008 highs at some point in 2024. The 10-year high in 2007-2008 topped out at 5.23%.
New Bond Issuance
Lastly, at the end of the month, the US Treasury Secretary will announce her plans to fund the US government through Q3. This is where the Treasury reveals the mix of bonds, notes, and bills they plan to issue in order to fund the government. Very recently the Treasury has been very calculating in determining the mix of securities issued, in an effort to influence yields and the yield curve. After all, the bond market is not immune to the effects of supply and demand. If the Treasury wants the long end of the curve to rise, it will issue more bonds, creating more supply, and pushing prices lower. The opposite is also true, if the Treasury wants to see the long end of the curve lower, it will issue fewer bonds, which would support the price of the bond, and the yield would move lower. This is exactly what the US Treasury did last October when they announced their plans to fund through Q1; they shifted the majority of new issuance to the front end (shorter-dated debt), issuing less in the long end, thus supporting price on 10- and 30-year bonds, resulting in lower yields.
Will the Treasury attempt to play this card again? I can’t say, but it’s definitely in their playbook.
Conclusion
There is no crystal ball, there are no guarantees, only probabilities. However, given all that I have highlighted, conditions seem ripe for some relief in bond yields and mortgage rates. For that reason, I am currently advising my mortgage clients to float their mortgage rates, time permitting.
To be crystal clear, I expect any reprieve to be fairly short-lived, weeks at best. The trend in yields is clearly higher, and data continues to support the trend. However, the 10-year could give up 30-40 bps, which would push most mortgage rates back to a 6-handle.