


Mortgage Rates: Ignoring The Data?
Depends on Which Data We're Talking About.

The Bond market and mortgage rates have surprised many. We have published several posts over the past few months suggesting that the outcome we are seeing was possible, if not probable. In this article, we will cover:
Why we believe yields have risen since an aggressive Fed Rate cut
Which data led us to our opinions
Using that data, what do we expect
Over the past five months, We have published several articles warning that this rate-cutting cycle would not go the way most in the mortgage industry expected. Most notably, the July post “The Unthinkable Steepener” described the steepening yield curve we are now experiencing. Then, in August, We published “ The Mortgage Rte Road Map May Get You Lost”, describing some of the unprecedented actions being taken to support and influence the yield curve, which would leave those expecting a “refi-boom” disappointed. Then, on the morning of September 18th, We published “Priced For Perfection”, where we explained in detail why we expected rates to rise, and we went so far as to make the call that low in mortgage rates for 2024 was in. I mention these articles because they go into detailed analysis.
What’s Happening
We’ve been told that lower mortgage rates will follow when the Fed begins the cutting cycle. Yet, the opposite has happened. The Fed Rate cut actually marked the low in recent yields. Dare we say it’s different this time? There are certainly many new pieces on the game board that haven’t been there in previous cycles. More on that in a minute.
The mortgage industry is looking at the same data they have looked at for decades: unemployment, inflation, consumer sentiment, manufacturing data, etc. Because, after all, the economy is not the market. True, but perhaps the market is becoming the economy. Friday, November 1st, is an excellent example of this. A much weaker-than-expected NFP report was released, which, by most accounts, should have led to bond prices rising when, in fact, the opposite occurred. Bond prices fell, and yields rose on the back of a much weaker-than-expected NFP report. This is a messy analogy because weather contributed to the weak headline NFP number. Still, traditional commentary would have never suggested that a 100K miss would lead to a 10bps move higher in the 10-year yield. As it happens, November 1 also saw the Reverse Repo Facility (RRP) drop to its lowest in more than 3-years. While the mortgage industry may be focused on the same old story, the market has focused on the most critical metric. Liquidity. We strongly believe market structure has become more important than the traditional indicators, at least for now, thanks to years of intervention from the Fed and, more recently, the Treasury.
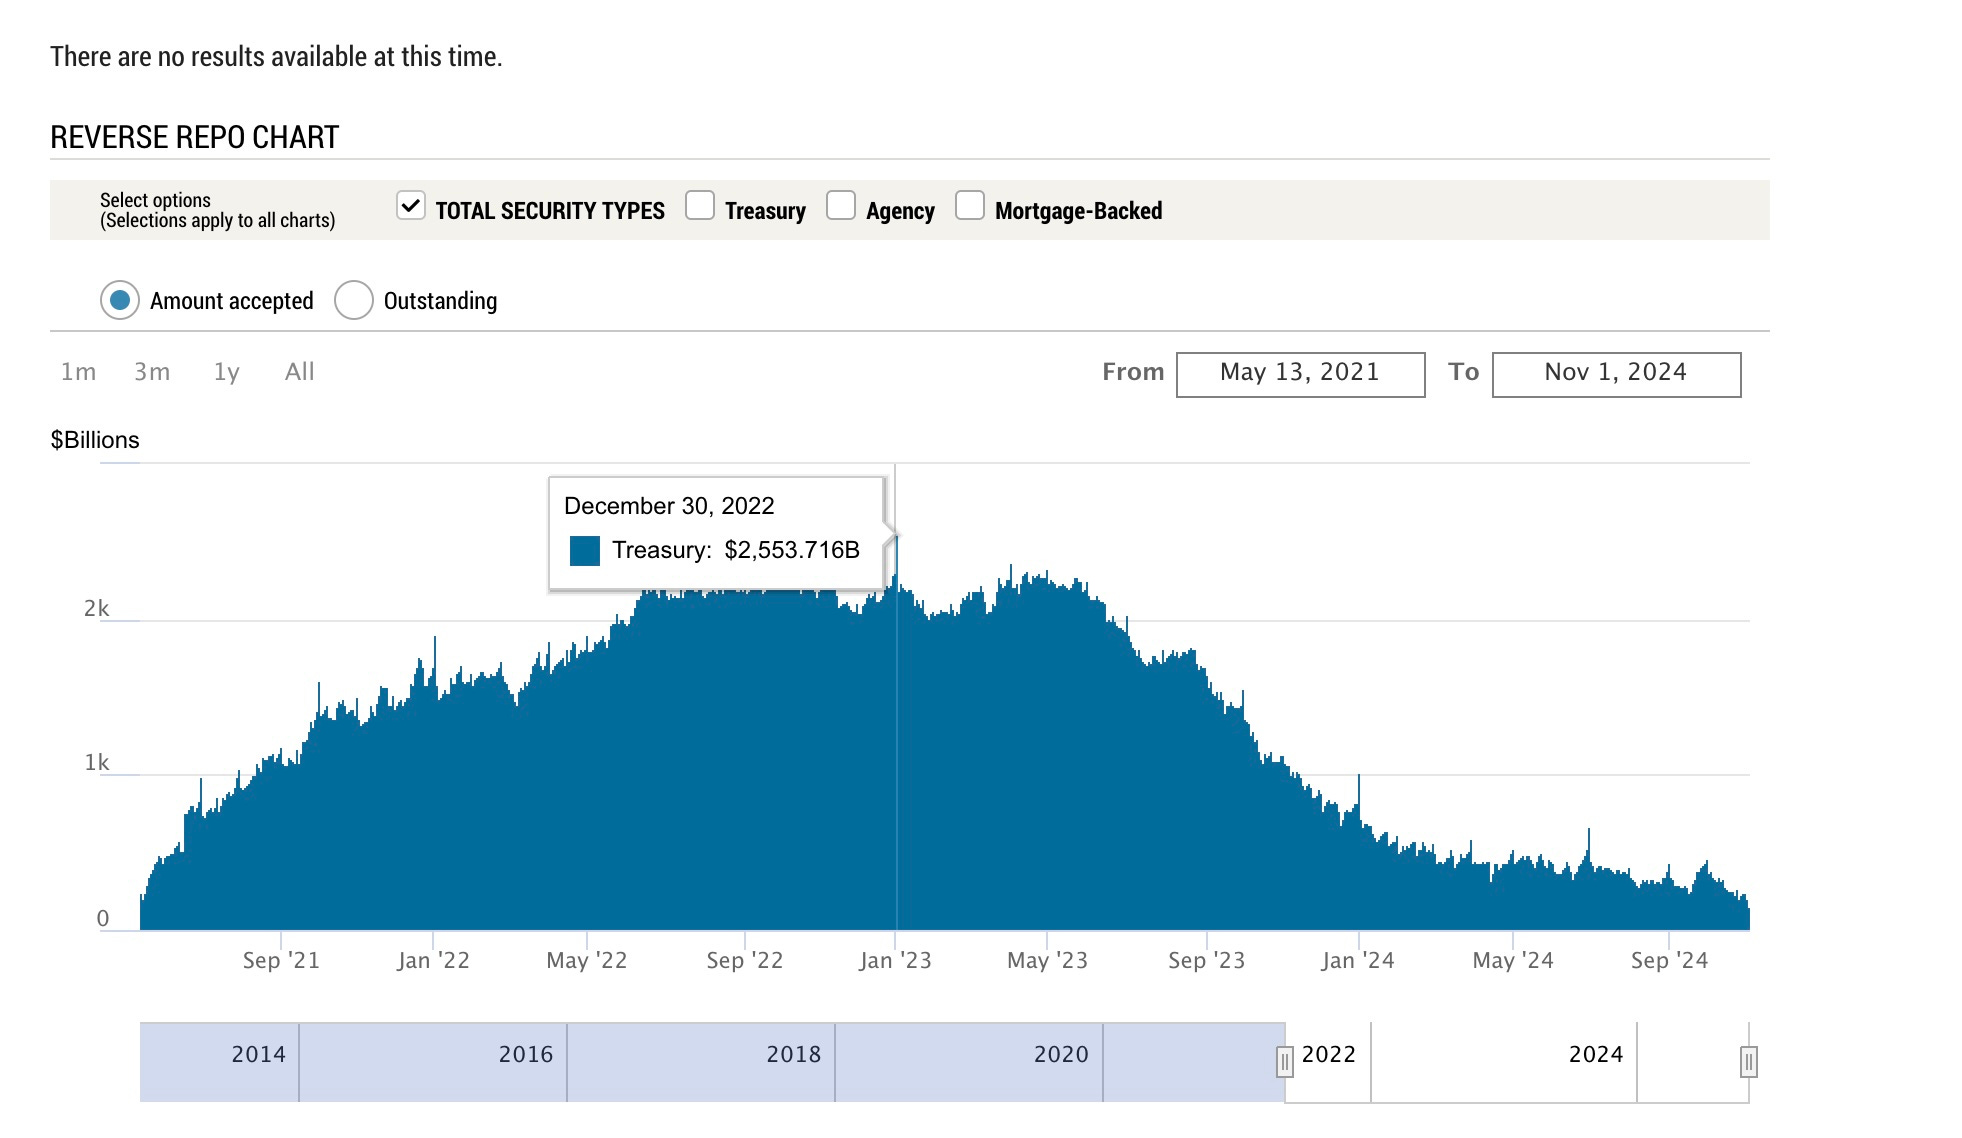
There are many ways to measure liquidity in markets. I have a few favorites that we turn to to get a sense of what to expect. The first is the RRP. This is a relatively new facility created by the Federal Reserve; it served to “soak up” excess liquidity during the CV-19 response. In December 2022, the RRP held a little more than $2.5 trillion. That is A LOT of “excess liquidity.”
That “excess liquidity” has been, in large part, responsible for continued equity market rallies, has supported bond prices and real estate prices, etc. Since the Fed began QT in 2022, the RRP has steadily declined as excess liquidity found a more permanent home. Whether this liquidity was allocated to equities, the Treasury market, other investments, or left the system/country, for the sake of this explanation, it doesn’t matter where it went; it’s no longer “excess.”
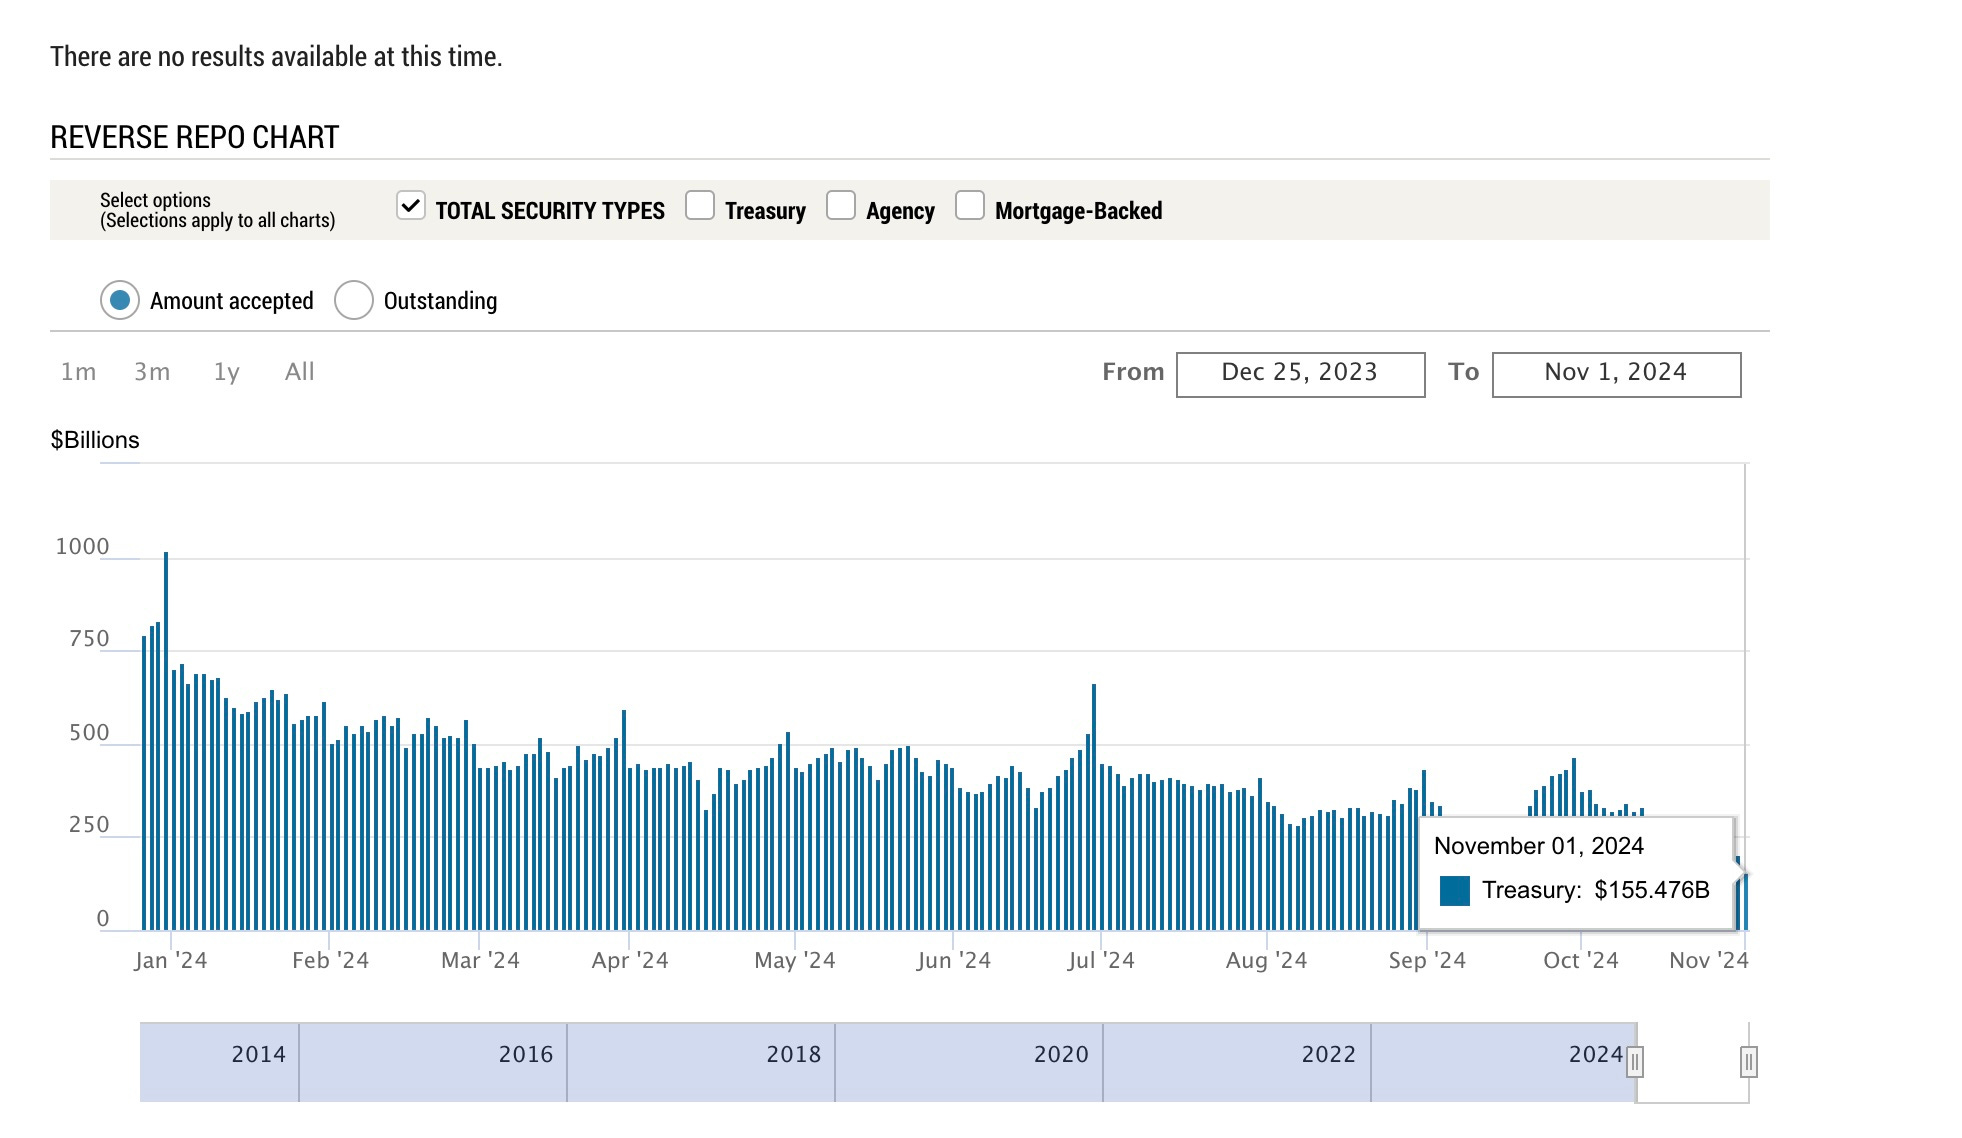
As of November 1, 2024, the RRP is now below $200 billion - its lowest level since 2021.
Why is this significant? To boil it down to the key takeaway, this excess liquidity has been, in large part, fueling the purchase of Treasuries. As this facility is drained, the system has less capital to soak up the increasing debt the U.S. government is issuing.
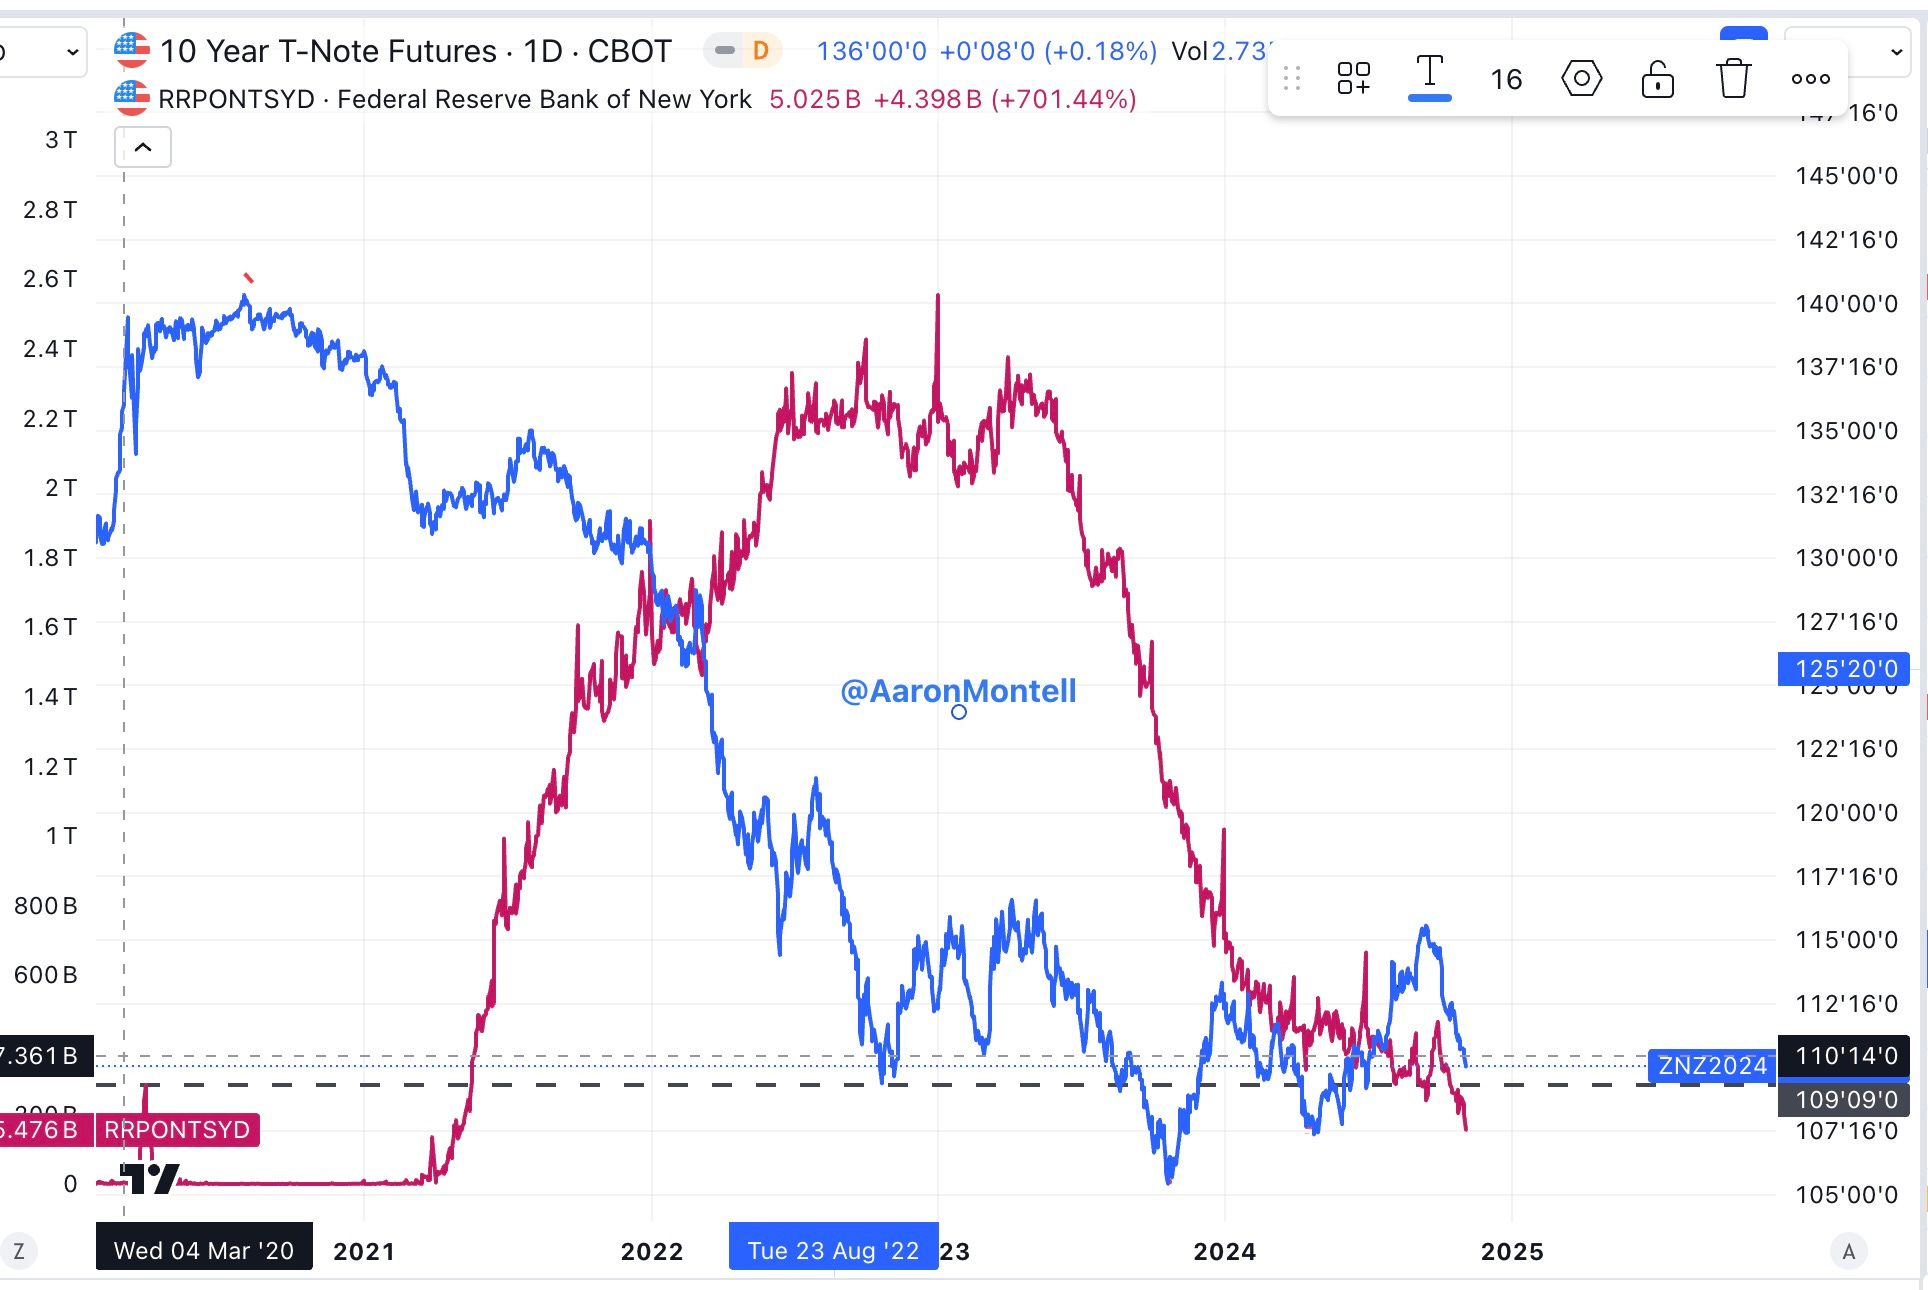
You’ll notice in the chart below that it took several months for liquidity to overwhelm the system after the initial response in March 2020, but once it did, the velocity at which the RRP (red line) grew was staggering. I am plotting RRP against 10-year Treasury Futures price (blue line), so as 10-year futures rise, the yield falls. As RRP has declined, 10-year Treasury futures have remained in a range. I believe the draining of the RRP has merely served to offset the increased issuance, which has led to 10-year futures remaining in this range, preventing yields from moving higher. The outcome may have been very different had the excess liquidity not been there; we’ll never know.
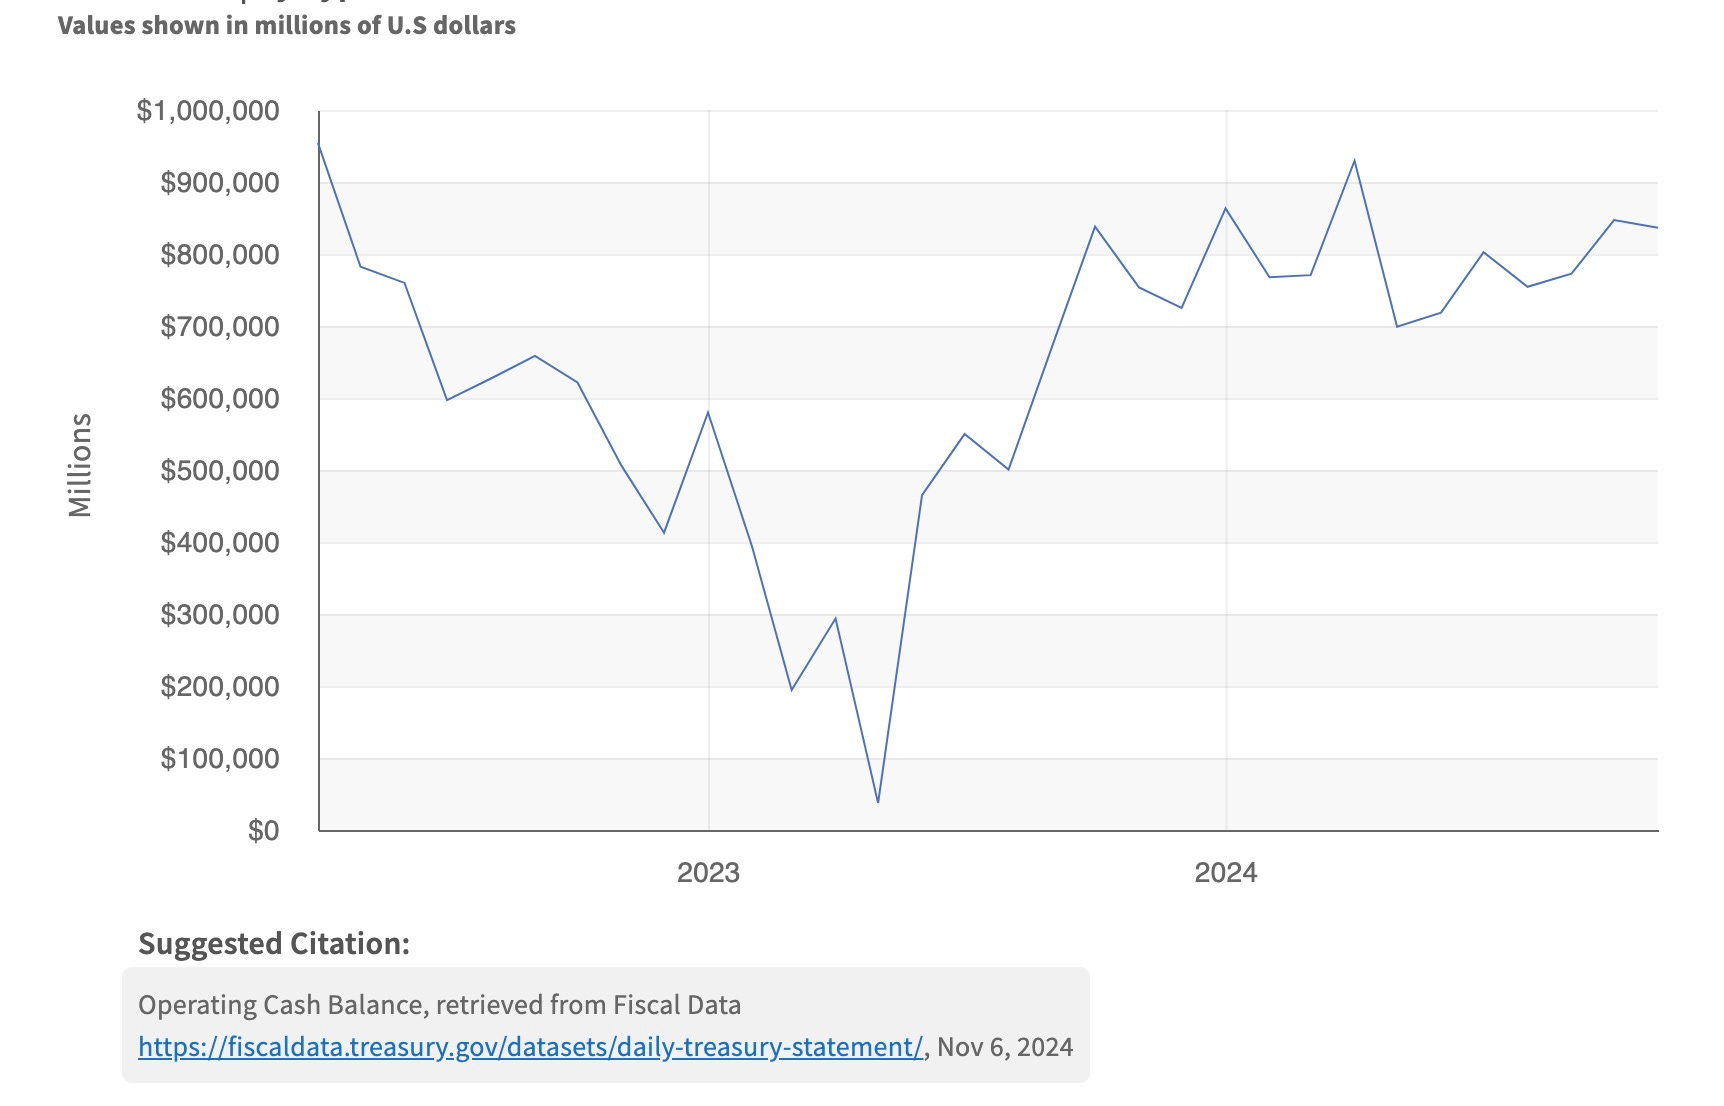
So, what happens when the RRP goes to zero? That’s a good question. The best we can figure is: nothing good. The U.S. Treasury Dept knows that, which is why Treasury is increasingly buying back large tranches of “off-the-run” Treasuries. “Off-the-run” Treasuries are Treasuries that were issued some time ago. It’s an effort to free up capital, aka liquidity, to support the Treasury market and the growing issuance needed to fund government deficits. By repurchasing off-the-run Treasuries, the investors or institutions that held those Treasuries will now have available capital to reinvest in “on-the-run” or new-issue Treasuries. This tells us that the Treasury Dept. knows there is a forthcoming liquidity issue for the Treasury market, which it is trying to get ahead of. This is also why I believe the Fed made such an aggressive first move despite data that didn't support such an aggressive move. The Fed and Treasury know they are staring down the barrel of a liquidity problem, and it’s the last thing they want to materialize. Don’t worry yet - it’s probably not an immanent calamity, as Janet Yellen has built up a tidy nest egg of more than $800b in the Treasury General Account (TGA), which she will be spending down in the coming months, providing more liquidity to the economy and markets.
We will have to wait and see how the next Treasury Secretary will proceed. But, make no mistake, the drawdown of the RRP will make the road less smooth for Treasuries (and equities).
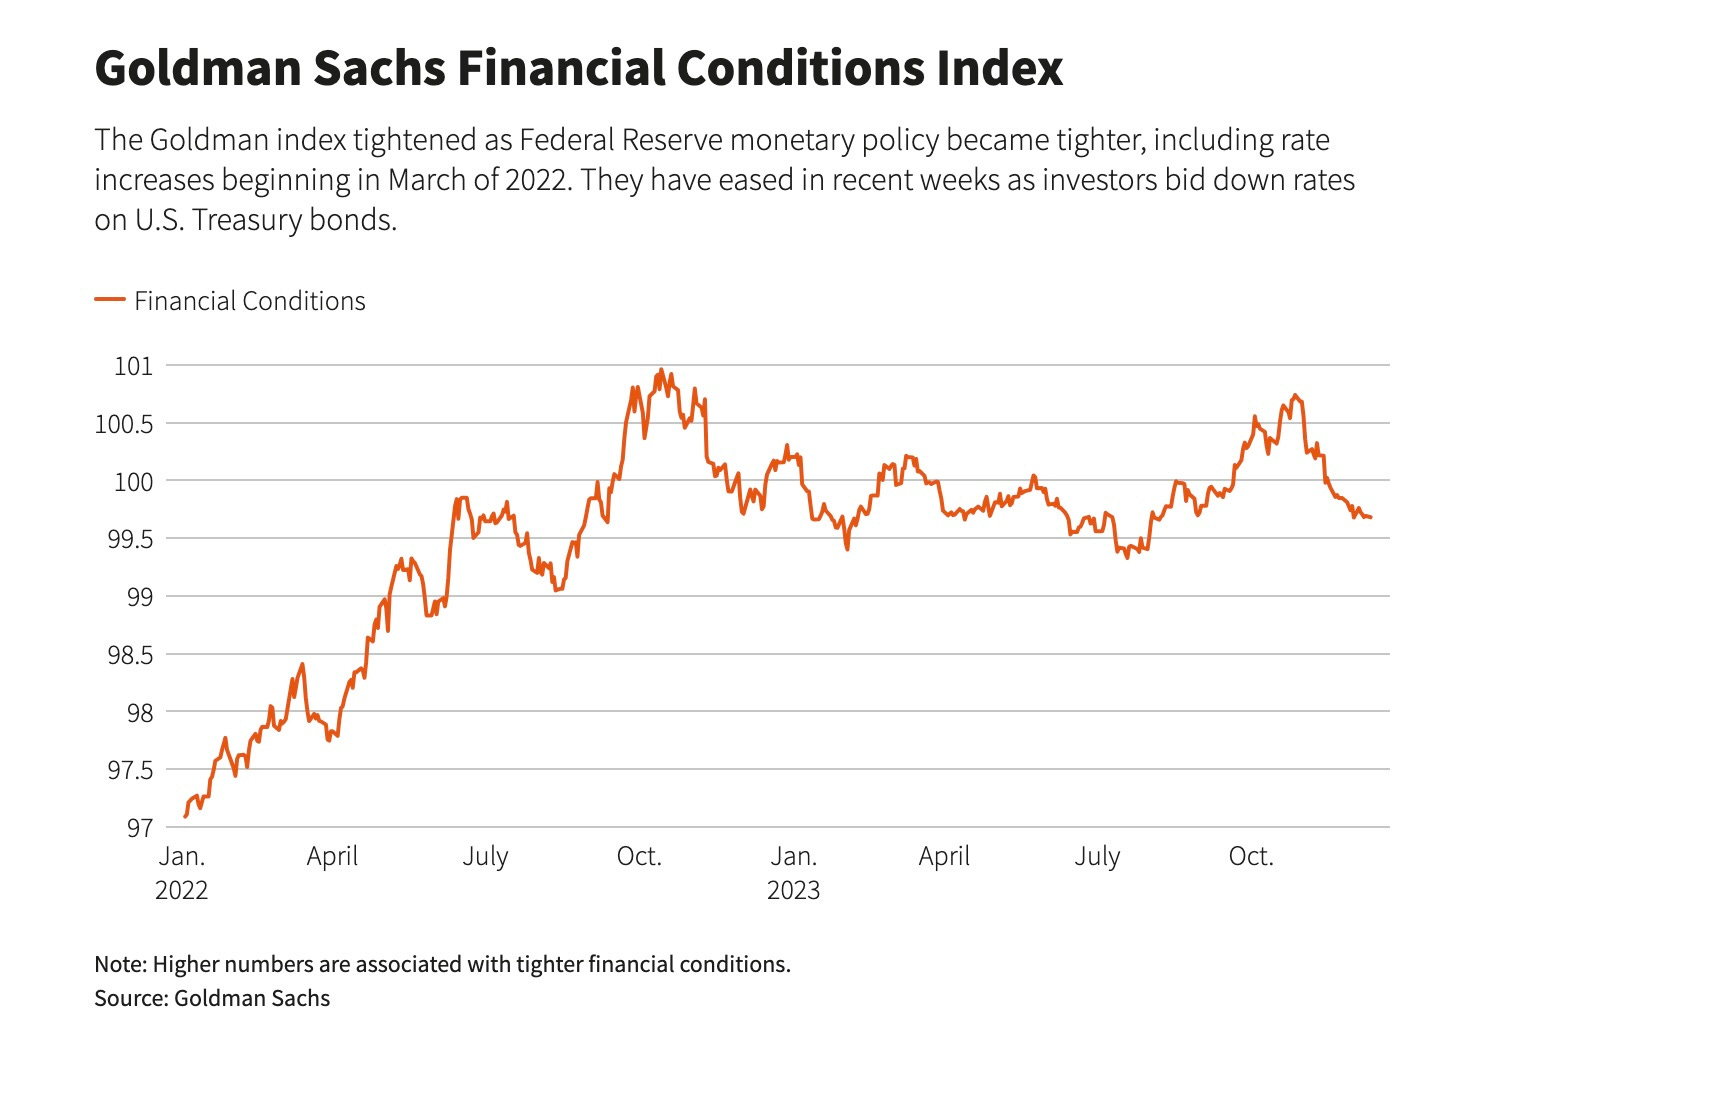
Another critical metric we follow is broadly known as “financial conditions.” “Financial conditions” is a somewhat vague term that includes things like the availability of credit, “swaps”, volatility, and credit spreads. Goldman Sachs publishes an index of financial conditions daily.
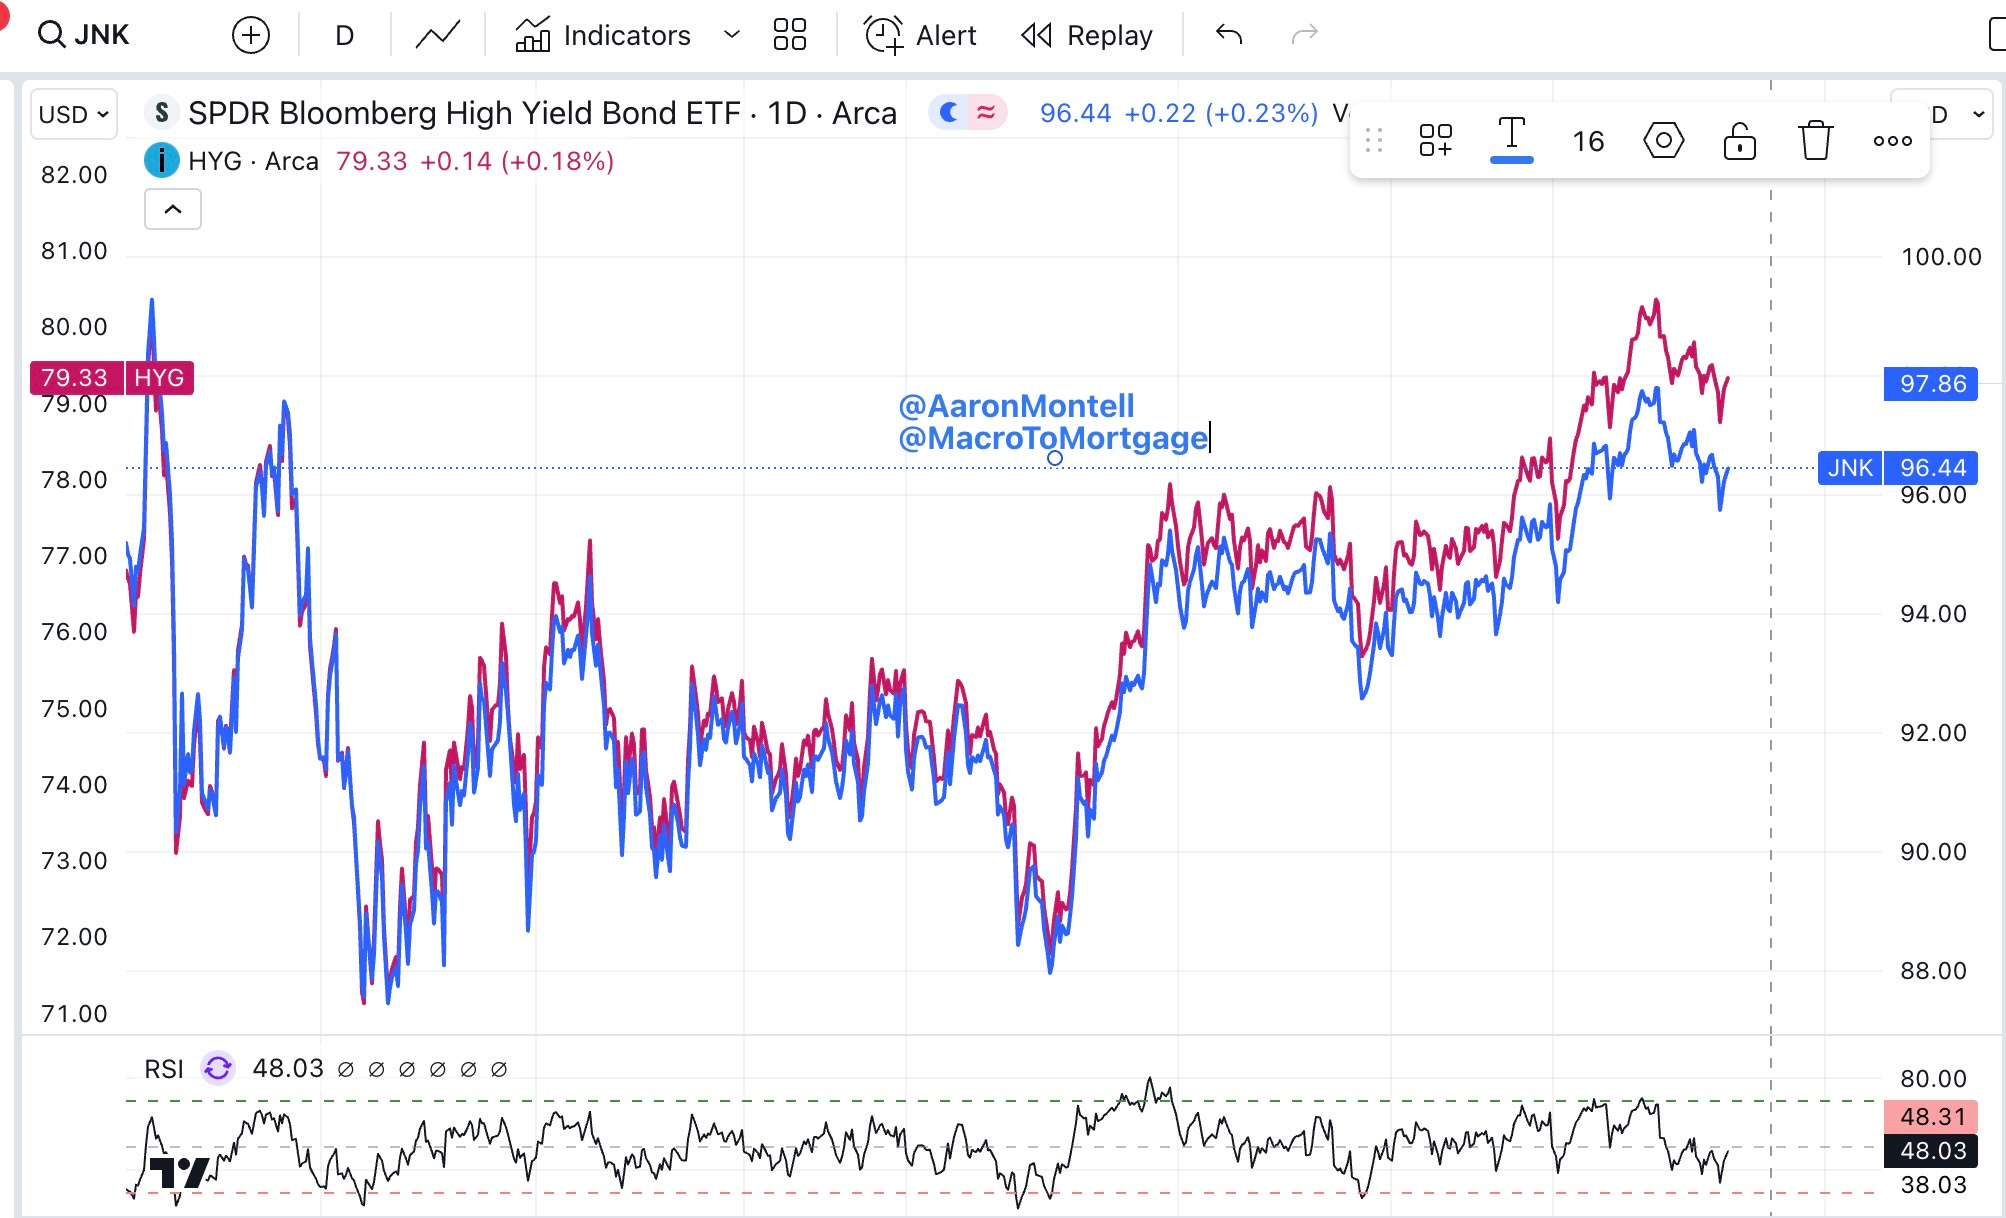
A back-of-the-envelope way to get a read on financial conditions is to monitor the appetite for corporate debt, specifically high-yield corporate debt. The quickest way to get a sense of the market's appetite for such debt is to follow the price of the ETFs JNK and HYG. The ETF JNK is corporate debt with a rating of BB+ or lower. HYG is very similar in the sense that it holds below-investment-grade corporate debt. The idea is that if the market begins to smell liquidity or credit problems, these ETFs would likely be where it would show up first. The chart below shows JNK (blue) and HYG (red) moving higher since the market bottomed in October 2022. Despite Fed policy, financial conditions have been easing since October 2022, to levels levels last seen in the Spring of 2022.
While liquidity may be becoming more scarce, financial conditions are loose. This suggests to me that the broader market is fine for now. Higher yields aren’t a concern. This suggests that equity and credit markets are not at all concerned with NFP, CPI, manufacturing, continuing claims, etc. If equity and credit markets aren’t too concerned, that means intervention is nowhere on the horizon. Perhaps the market is expecting the TGA to bridge the liquidity gap. The point is: with intervention nowhere to be seen, this tells me things can get much worse in the Treasury market before they have to improve.
Conclusion
The conclusion is this: The “legacy” economic indicators many in the mortgage industry have used for decades to set their expectations, as well as clients expectations, don’t seem as telling or useful as they’ve been in previous cycles; they have largely failed to foretell accurate outcomes this cycle. Perhaps years of Fed liquidity injections and other forms of intervention have led to the distortions that render these indicators less useful. For whatever reason, liquidity now seems to be a bellwether indicator in current markets. If liquidity is king, follow it!